Fig. 7
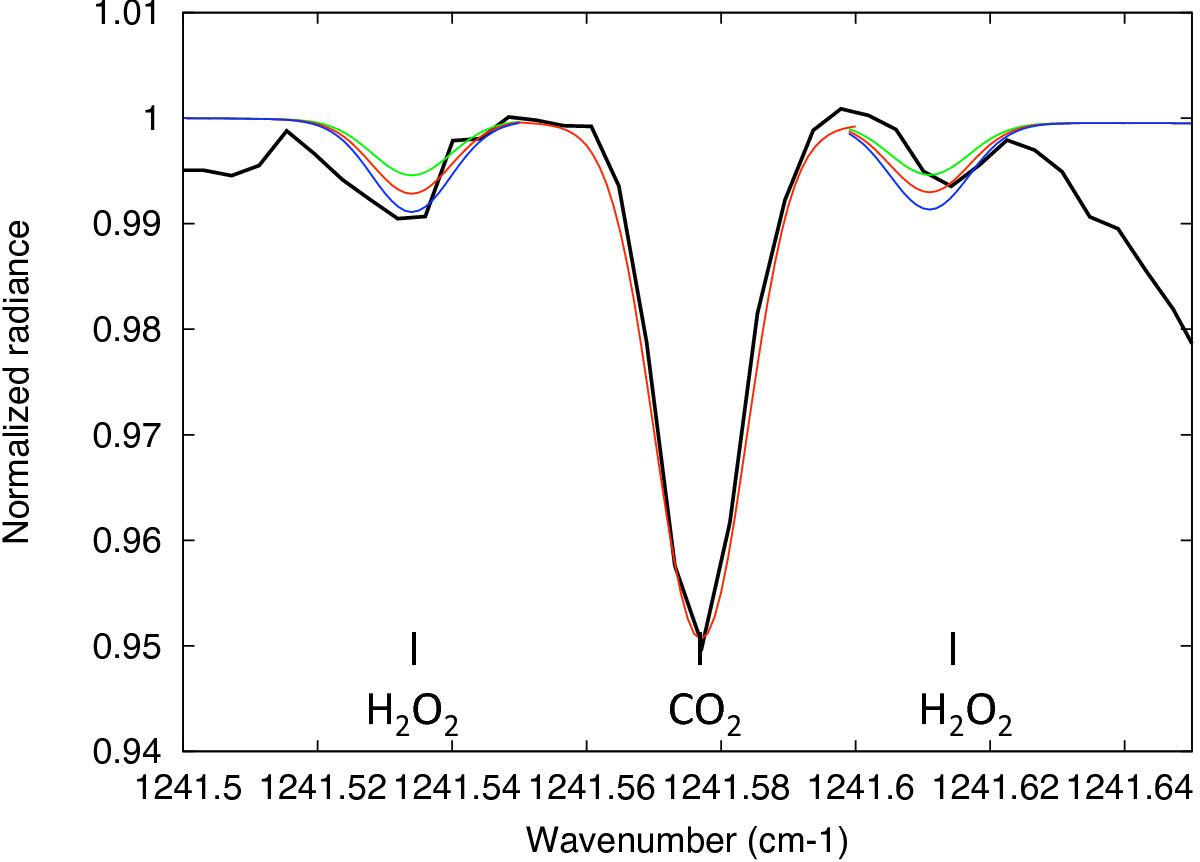
Thick black line: TEXES spectrum of Mars in the vicinity of H2O2 and CO2 lines around 1241.58 cm-1 (March 1, 2014, Ls = 96°), integrated over Region A (9 pixels), compared with synthetic spectra. The continuum fluctuation in the TEXES data was corrected by using the continuum on each side of each line and assuming a straight line between these two points. The airmass is 1.20. Models: H2O2 = 15 ppbv (green), 20 ppbv (red), 25 ppbv (blue). The best fit is obtained for H2O2 = 20 ppbv.
Current usage metrics show cumulative count of Article Views (full-text article views including HTML views, PDF and ePub downloads, according to the available data) and Abstracts Views on Vision4Press platform.
Data correspond to usage on the plateform after 2015. The current usage metrics is available 48-96 hours after online publication and is updated daily on week days.
Initial download of the metrics may take a while.