Fig. 4
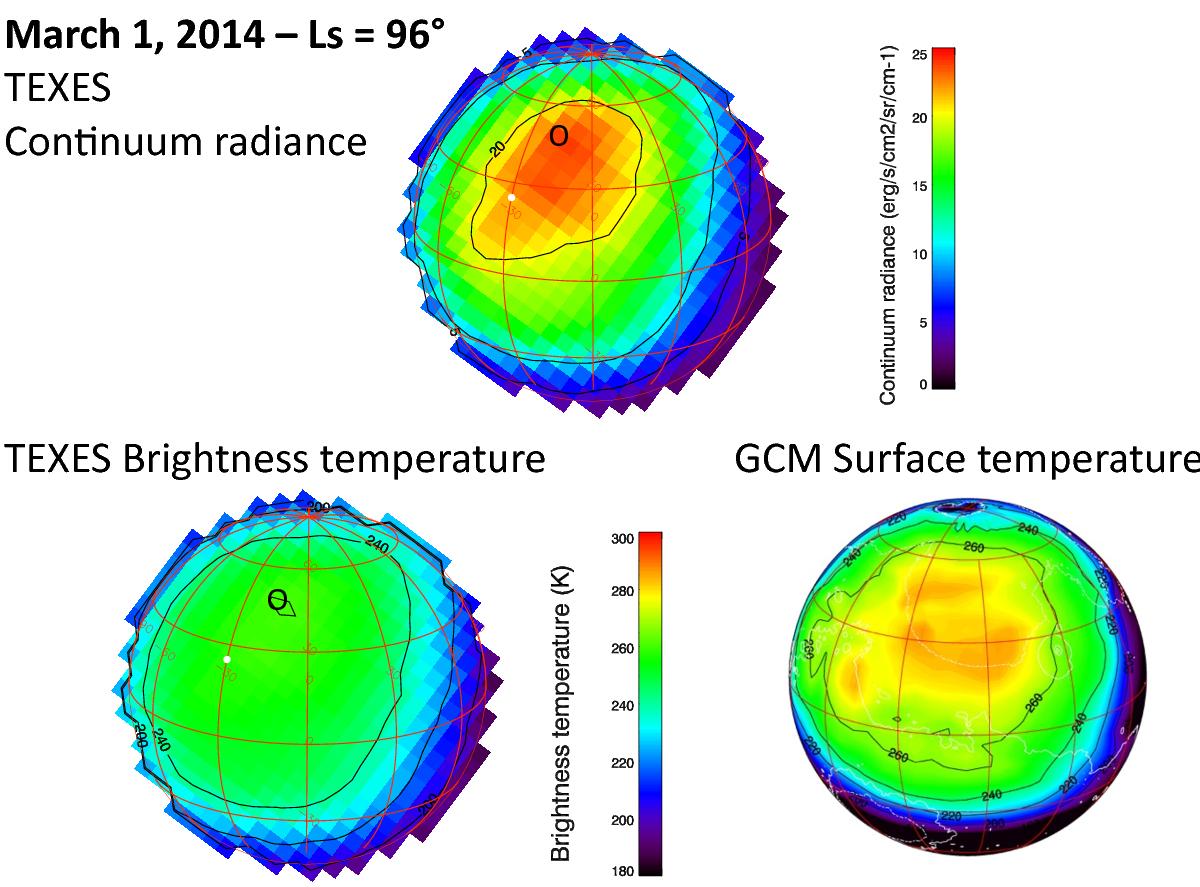
Top: continuum radiance map of the Martian disk recorded at 1241.50 cm-1 on March 1, 2014 (Ls = 96°). Bottom left: brightness temperature TEXES map converted from the radiance map, assuming a surface emissivity of 1.0. The subsolar point is indicated with a white dot. The black circle corresponds to Region A where the TEXES spectra were modeled (see text). Bottom right: synthetic map of the surface temperature retrieved from the GCM under similar observing conditions.
Current usage metrics show cumulative count of Article Views (full-text article views including HTML views, PDF and ePub downloads, according to the available data) and Abstracts Views on Vision4Press platform.
Data correspond to usage on the plateform after 2015. The current usage metrics is available 48-96 hours after online publication and is updated daily on week days.
Initial download of the metrics may take a while.