Fig. A.7
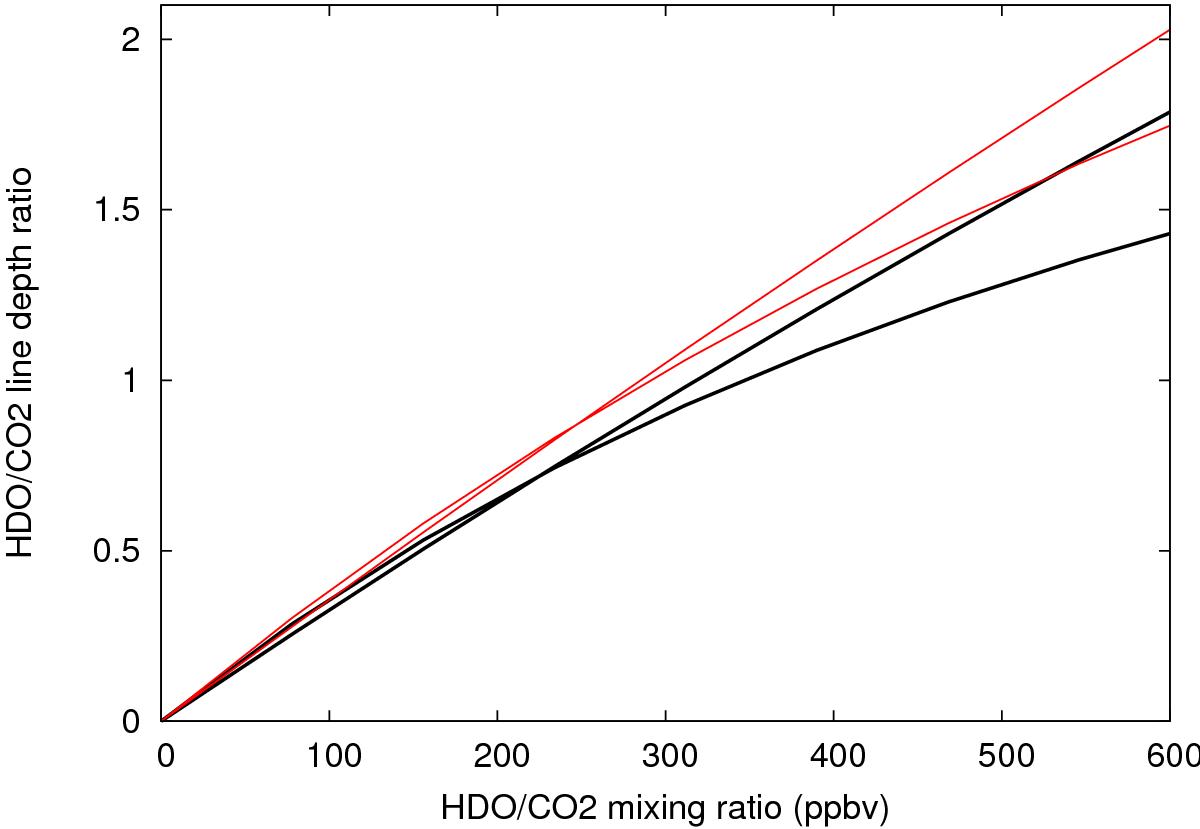
Variations of the HDO/CO2 line depth ratio as a function of the HDO mixing ratio for two extreme profiles (black lines: Model 2; red lines: Model 5), for two different values of the airmass (am = 1.0 and 5.0). It can be seen that, for low values of the line depth ratio, the behavior is similar to the H2O2 case (Fig. A.4). The curves converge in a single point where this ratio is close to 0.7−0.9, and diverge again for higher values of the line depth ratio.
Current usage metrics show cumulative count of Article Views (full-text article views including HTML views, PDF and ePub downloads, according to the available data) and Abstracts Views on Vision4Press platform.
Data correspond to usage on the plateform after 2015. The current usage metrics is available 48-96 hours after online publication and is updated daily on week days.
Initial download of the metrics may take a while.