Free Access
Fig. A.6
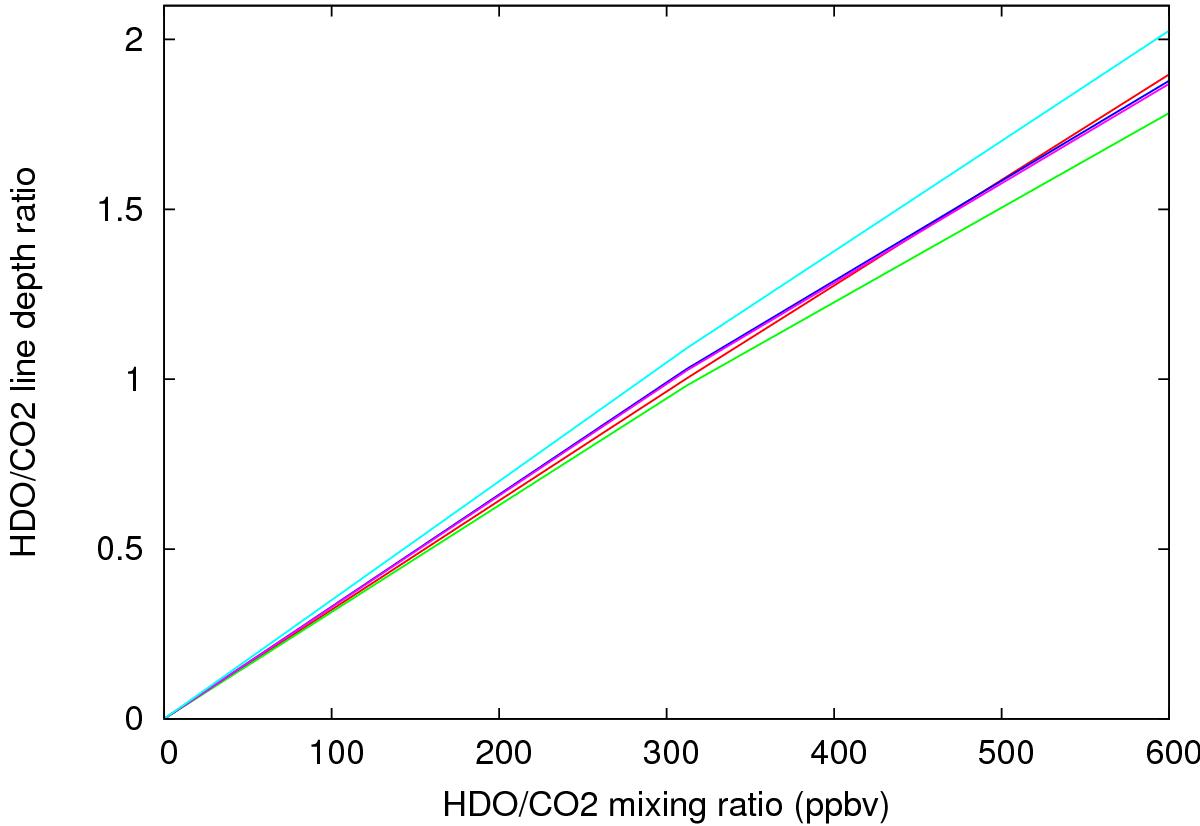
Variations of the HDO line depth ratio as a function of the HDO mixing ratio for the five different profiles. All curves are close to linear within 2%. Models 2 (maximum surface-atmosphere temperature contrast) and 5 (minimum surface-atmosphere temperature contrast) represent the two extreme cases.
Current usage metrics show cumulative count of Article Views (full-text article views including HTML views, PDF and ePub downloads, according to the available data) and Abstracts Views on Vision4Press platform.
Data correspond to usage on the plateform after 2015. The current usage metrics is available 48-96 hours after online publication and is updated daily on week days.
Initial download of the metrics may take a while.