Free Access
Fig. A.4
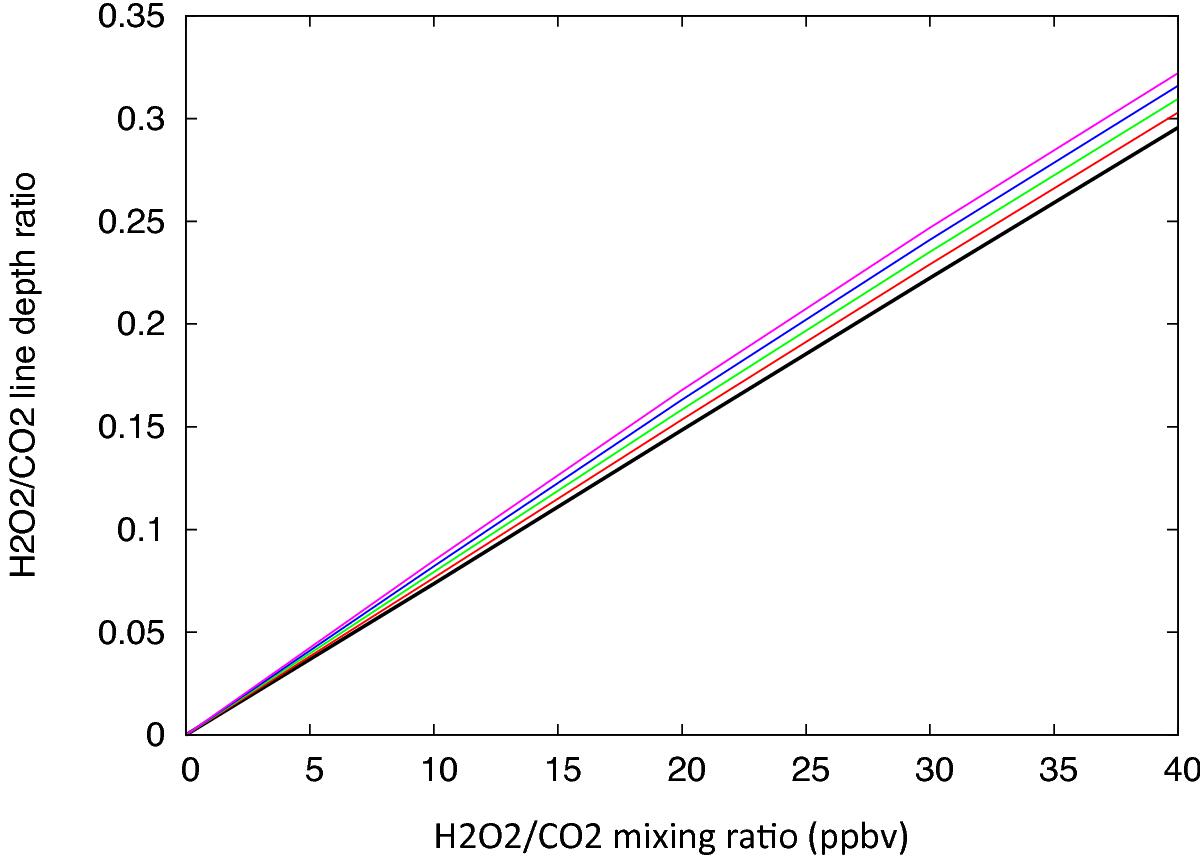
Variations of the H2O2 line depth ratio as a function of the H2O2 mixing ratio for the nominal profile (1), for different values of the airmass (am = 1.0, 2.0, 3.0, 4.0 and 5.0). It can be seen that the departure from the am = 1 curve is linear and proportional to the quantity (am – 1.0).
Current usage metrics show cumulative count of Article Views (full-text article views including HTML views, PDF and ePub downloads, according to the available data) and Abstracts Views on Vision4Press platform.
Data correspond to usage on the plateform after 2015. The current usage metrics is available 48-96 hours after online publication and is updated daily on week days.
Initial download of the metrics may take a while.