Fig. A.2
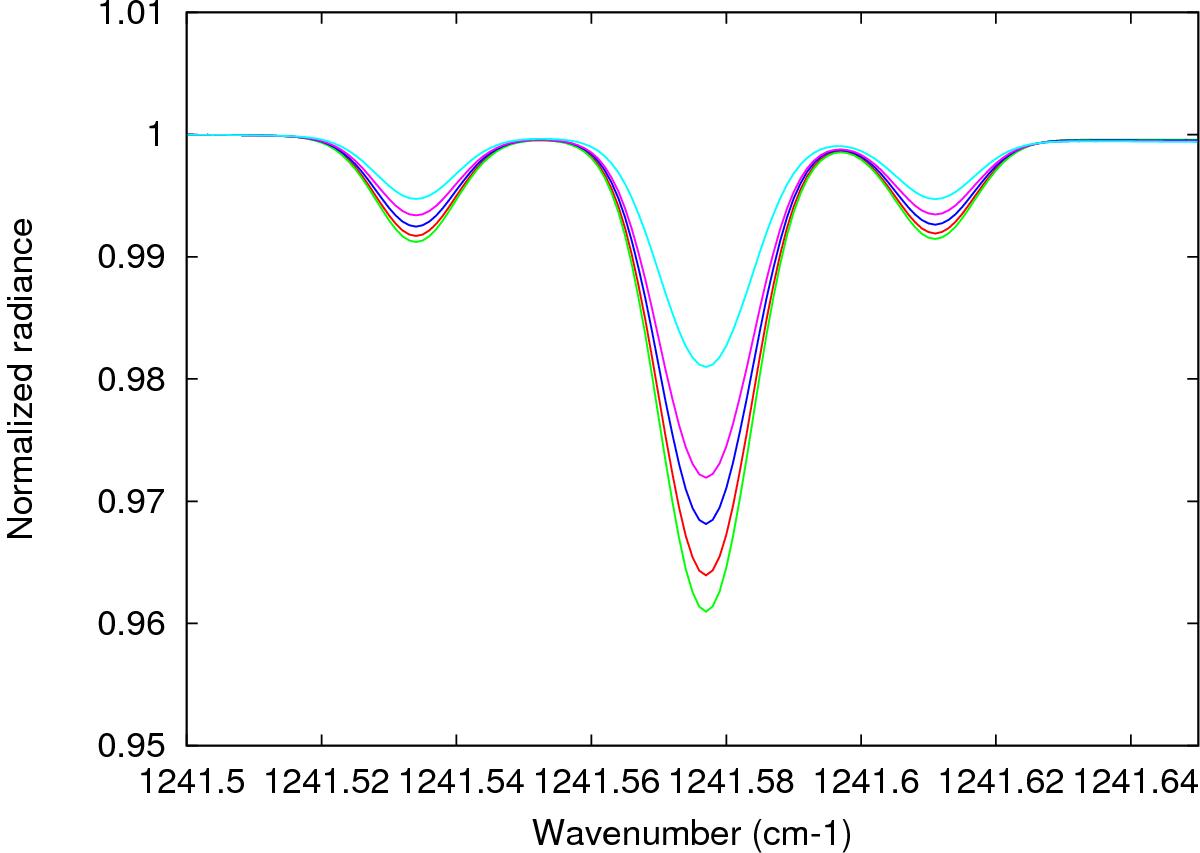
Spectra of the H2O2 and CO2 lines calculated with the five thermal profiles described above, for an airmass factor of 1.0 (disk.center), and for a H2O2 mixing ratio of 30 ppbv. The color code is the same as for Fig. A.1. Red: nominal model (1); green: Model 2; blue: Model 3; purple: Model 4; light blue: Model 5. The two extreme absorption cases correspond to Model 2 (maximum absorption) and Model 5 (minimum absorption).
Current usage metrics show cumulative count of Article Views (full-text article views including HTML views, PDF and ePub downloads, according to the available data) and Abstracts Views on Vision4Press platform.
Data correspond to usage on the plateform after 2015. The current usage metrics is available 48-96 hours after online publication and is updated daily on week days.
Initial download of the metrics may take a while.