Fig. A.1
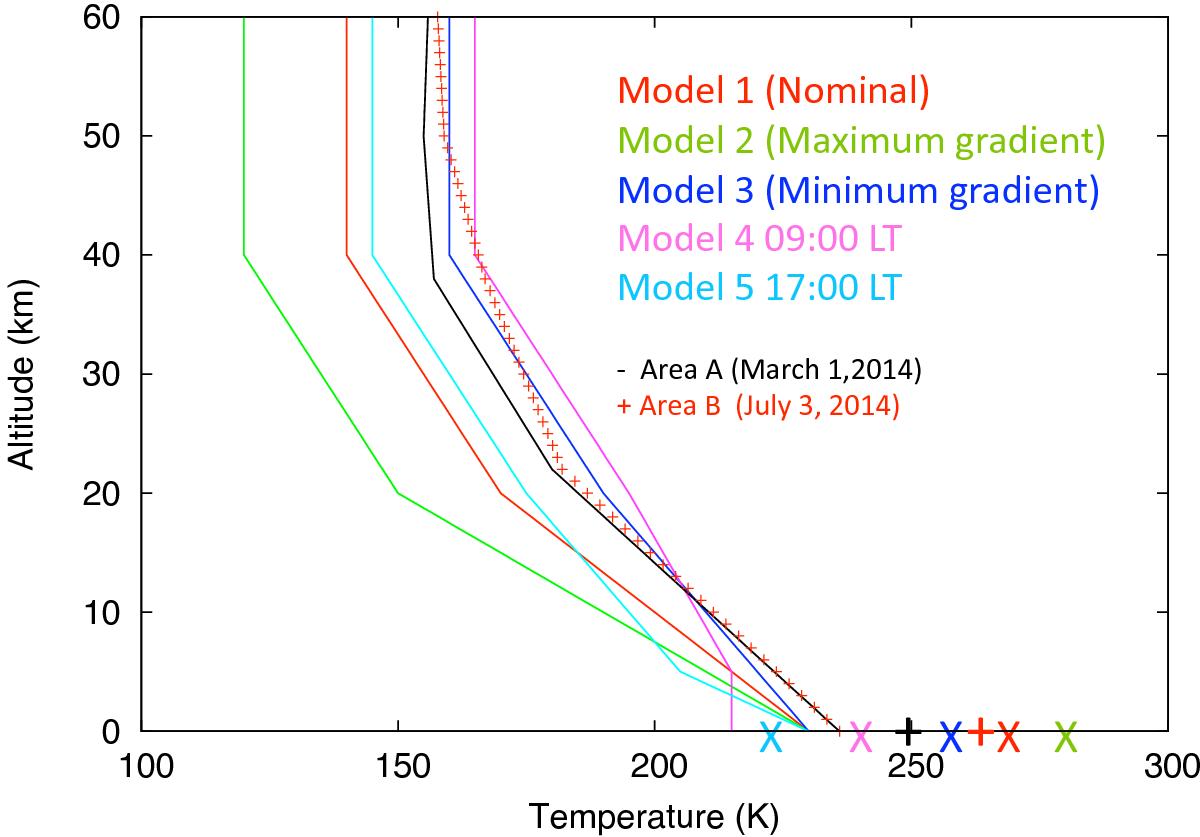
Thermal profiles used for the analysis of the line depth ratio method. Surface temperatures are indicated by Xs on the x-axis. A mean surface pressure of 6 mbars is assumed in all cases. The nominal profile (1, in red), with a temperature gradient of −3 K/km in the lower stratosphere and a surface temperature contrast Ts – T(0) of 40 K, is close to the GCM profile at the center of the disk in March 2014. The two next profiles (2 and 3, in green and blue) show changes in the temperature gradients from −4 K/km to −2 K/km and surface temperature contrasts of 50 K and 30 K respectively; they illustrate two extreme cases of the temperature contrast between the surface and the atmosphere. The forth profile (4), in purple, is isothermal in the first 5 km with a temperature contrast of 25 K. It corresponds to morning conditions in July 2014 and is close to the GCM profile at the center of the disk for this second run. Finally the fifth profile (5, in light blue) illustrates late afternoon conditions (LT = 17:00) for the March 2014 observations, with a temperature inversion [Ts – T(0)] of −25 K. The two profiles derived from the GCM for Areas A and B (see text, Sects. 3.1.2 and 3.2.2) are also shown in the figure (black curve: Area A; red crosses: Area B). The corresponding surface temperatures are indicated by plus signs on the x-axis. The corresponding surface pressures for Areas A and B are 8.3 mbar and 5.4 mbar, respectively.
Current usage metrics show cumulative count of Article Views (full-text article views including HTML views, PDF and ePub downloads, according to the available data) and Abstracts Views on Vision4Press platform.
Data correspond to usage on the plateform after 2015. The current usage metrics is available 48-96 hours after online publication and is updated daily on week days.
Initial download of the metrics may take a while.