Fig. 17
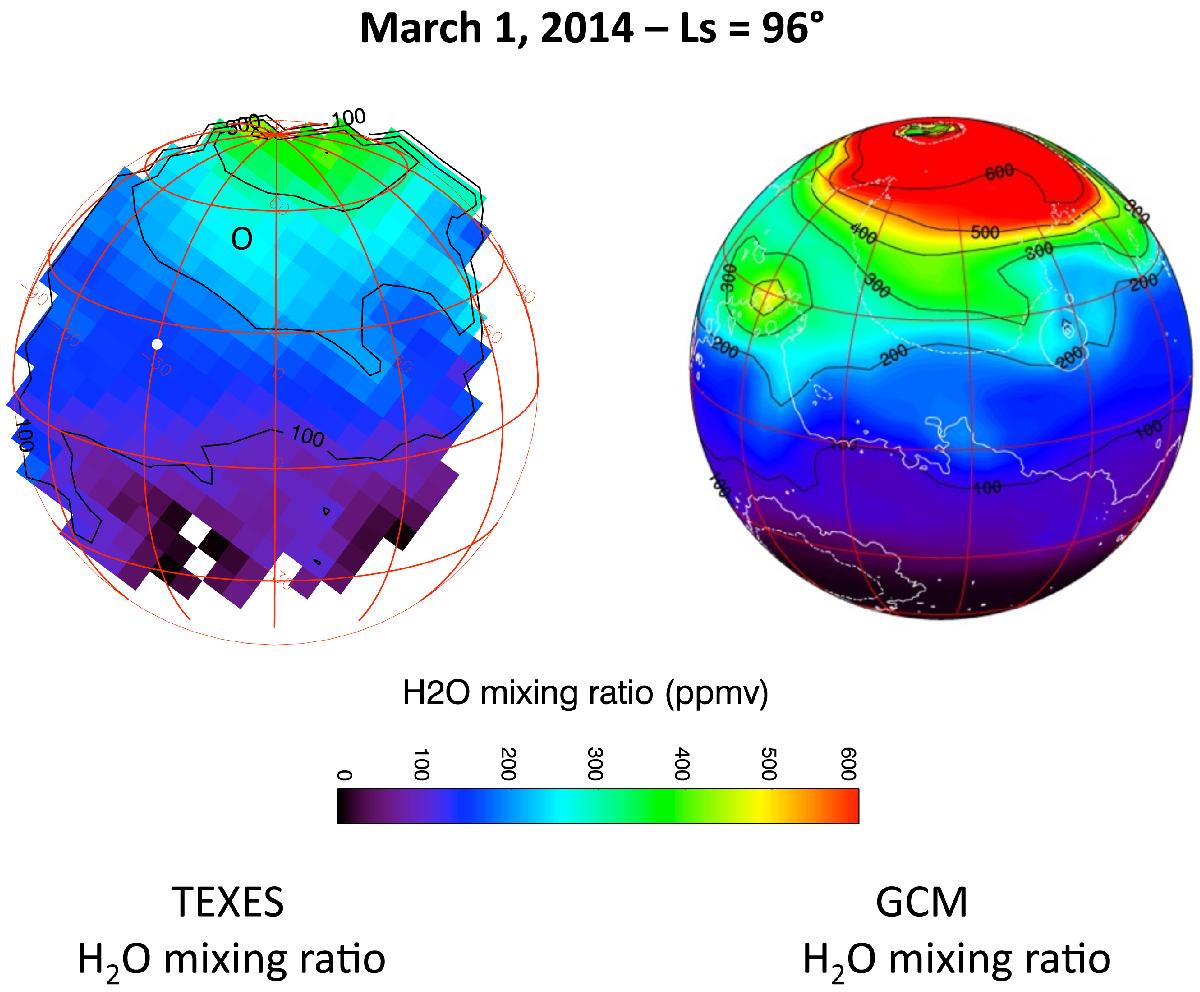
Left: map of the H2O/CO2 mixing ratio (in ppmv) retrieved from the TEXES data recorded on March 1, 2014 (Ls = 96°), converted from the HDO/CO2 mixing ratio map (Fig. 8), assuming a Martian mean D/H ratio of 5 times the terrestrial value. The black circle corresponds to region A where the TEXES spectra were modeled (see text). Right: GCM synthetic map of the H2O2/CO2 column-averaged mixing ratio (in ppmv) calculated for the same observing conditions.
Current usage metrics show cumulative count of Article Views (full-text article views including HTML views, PDF and ePub downloads, according to the available data) and Abstracts Views on Vision4Press platform.
Data correspond to usage on the plateform after 2015. The current usage metrics is available 48-96 hours after online publication and is updated daily on week days.
Initial download of the metrics may take a while.