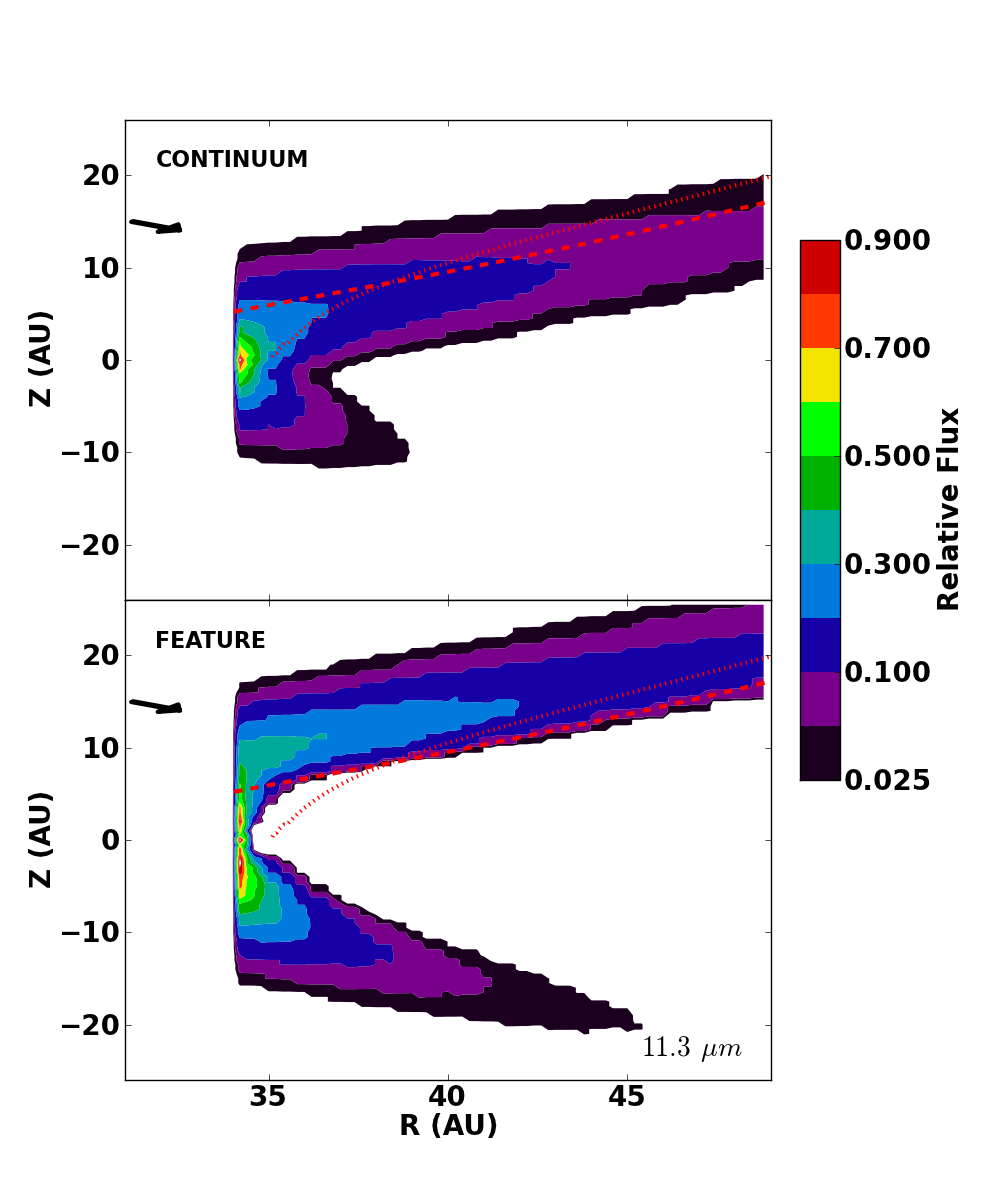
Fig. 15
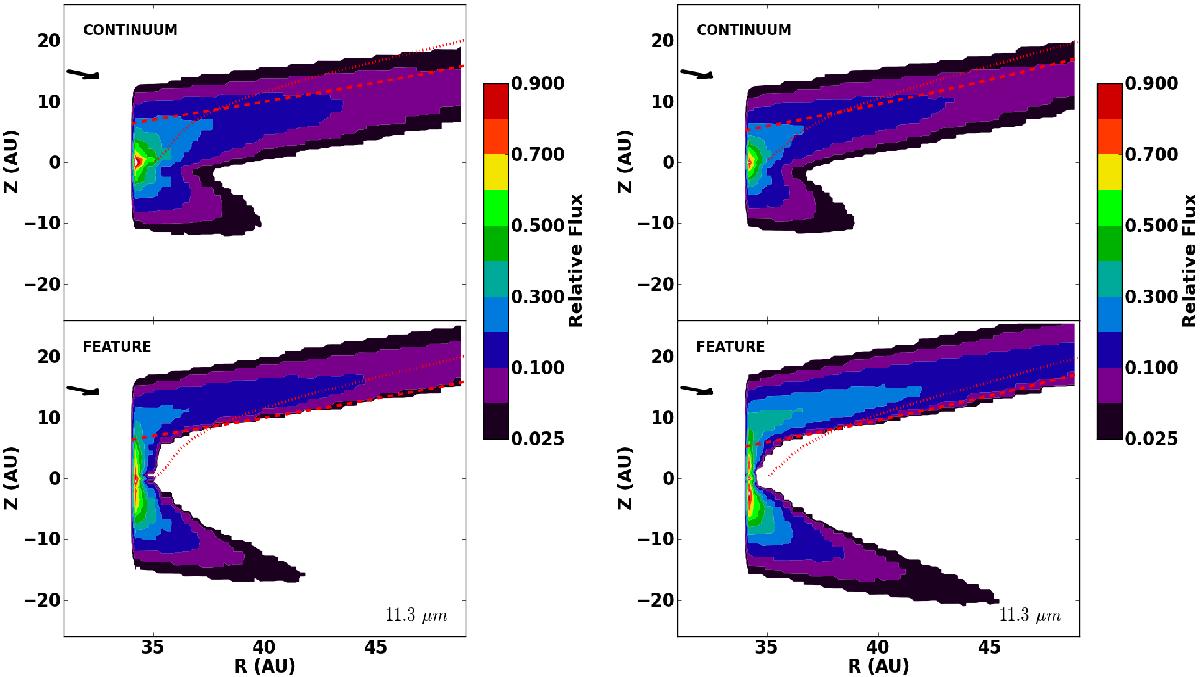
Flux contribution at 11.3 μm as a function of radius and height in the disk, for the continuum (from interpolating nearby continuum wavelengths) and the feature. The red dashed and dotted lines represent the vertical and radial τ = 1 surfaces at 11.3 μm, respectively. Left panel: the base model with 1% of 0.1 μm forsterite grains. Right panel: the “New Forst.” model explained in Sect. 7.2. The arrow indicates the viewing direction.
Current usage metrics show cumulative count of Article Views (full-text article views including HTML views, PDF and ePub downloads, according to the available data) and Abstracts Views on Vision4Press platform.
Data correspond to usage on the plateform after 2015. The current usage metrics is available 48-96 hours after online publication and is updated daily on week days.
Initial download of the metrics may take a while.