Fig. 12
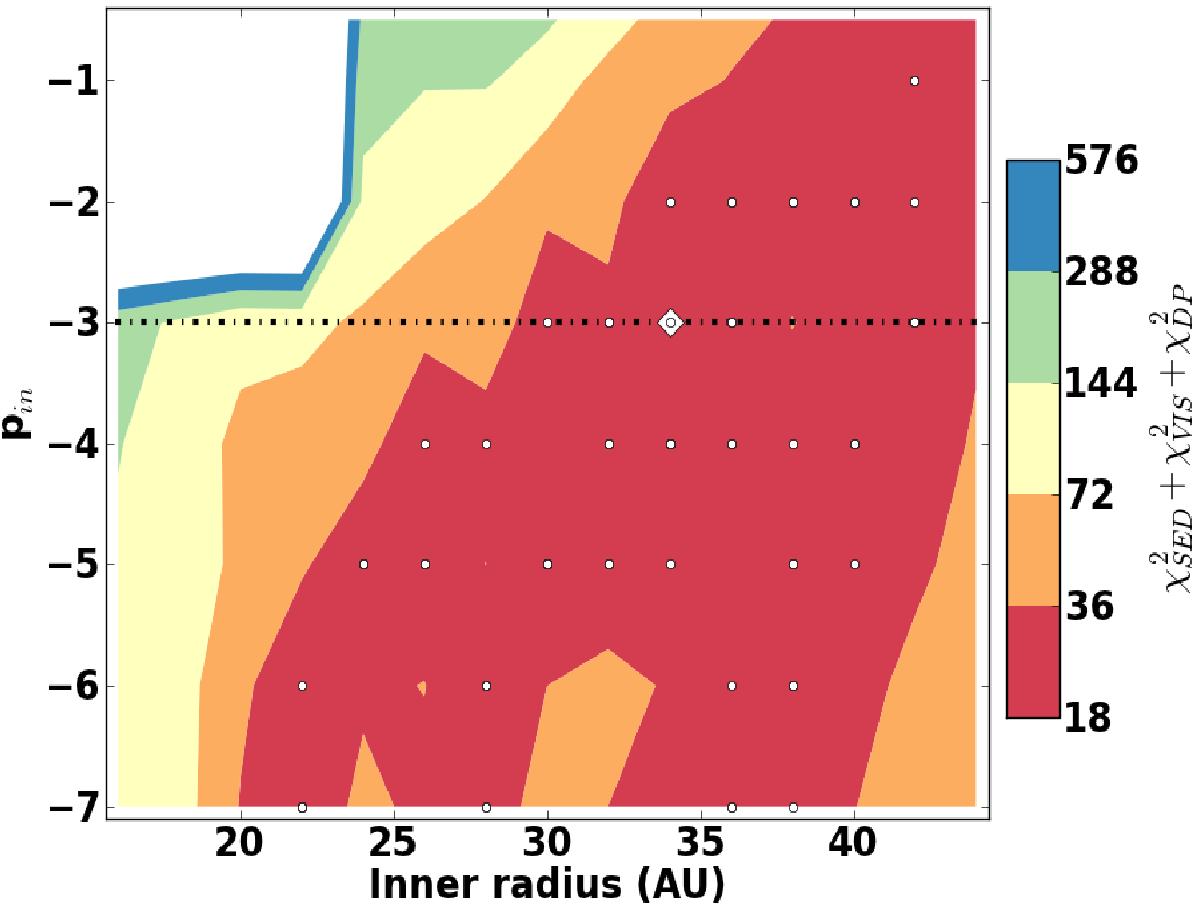
χ2 map of the inner radius Rin versus the inner surface density power-law pin. For each value of these two parameters, the model with the lowest ![]() in the grid is included in the χ2 map. The white dots indicate the models that were recomputed with a forsterite abundance of 1% included. The white diamond denotes the location of our base model. The black dot-dashed line shows the boundary between our original and the extended grid.
in the grid is included in the χ2 map. The white dots indicate the models that were recomputed with a forsterite abundance of 1% included. The white diamond denotes the location of our base model. The black dot-dashed line shows the boundary between our original and the extended grid.
Current usage metrics show cumulative count of Article Views (full-text article views including HTML views, PDF and ePub downloads, according to the available data) and Abstracts Views on Vision4Press platform.
Data correspond to usage on the plateform after 2015. The current usage metrics is available 48-96 hours after online publication and is updated daily on week days.
Initial download of the metrics may take a while.