Free Access
Fig. 10
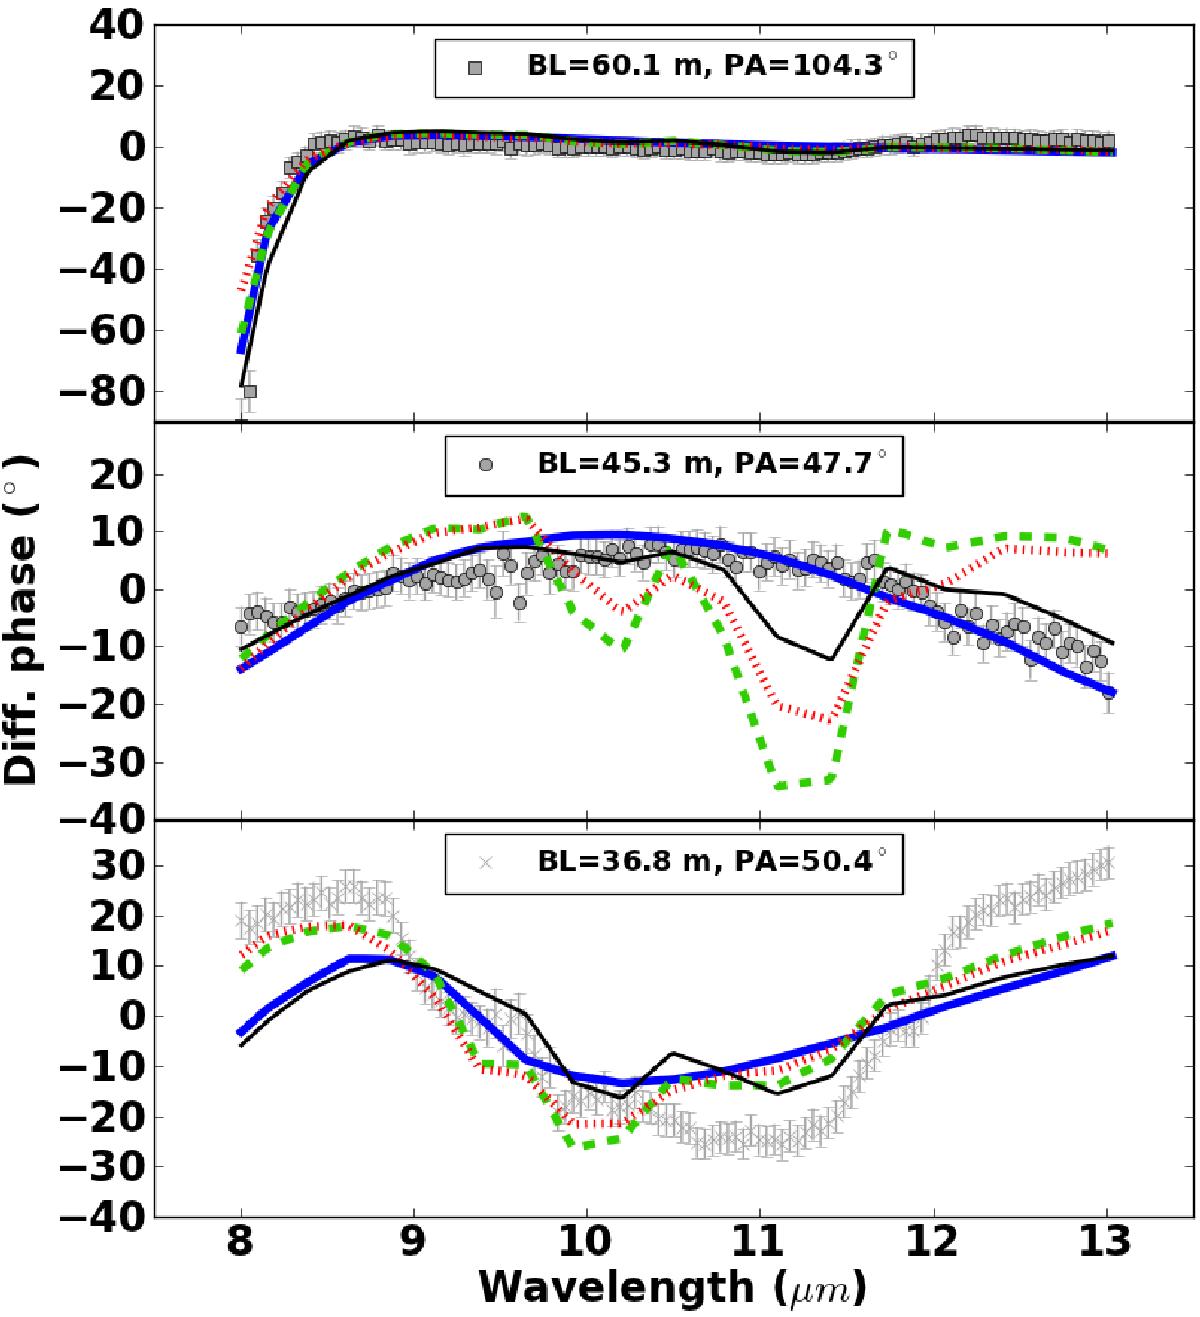
MIDI DPs of AC Her at the three baselines (one in each panel) as a function of wavelength. Overplotted are the predictions for the same radiative transfer models as in Fig. 9.
Current usage metrics show cumulative count of Article Views (full-text article views including HTML views, PDF and ePub downloads, according to the available data) and Abstracts Views on Vision4Press platform.
Data correspond to usage on the plateform after 2015. The current usage metrics is available 48-96 hours after online publication and is updated daily on week days.
Initial download of the metrics may take a while.