Fig. 10
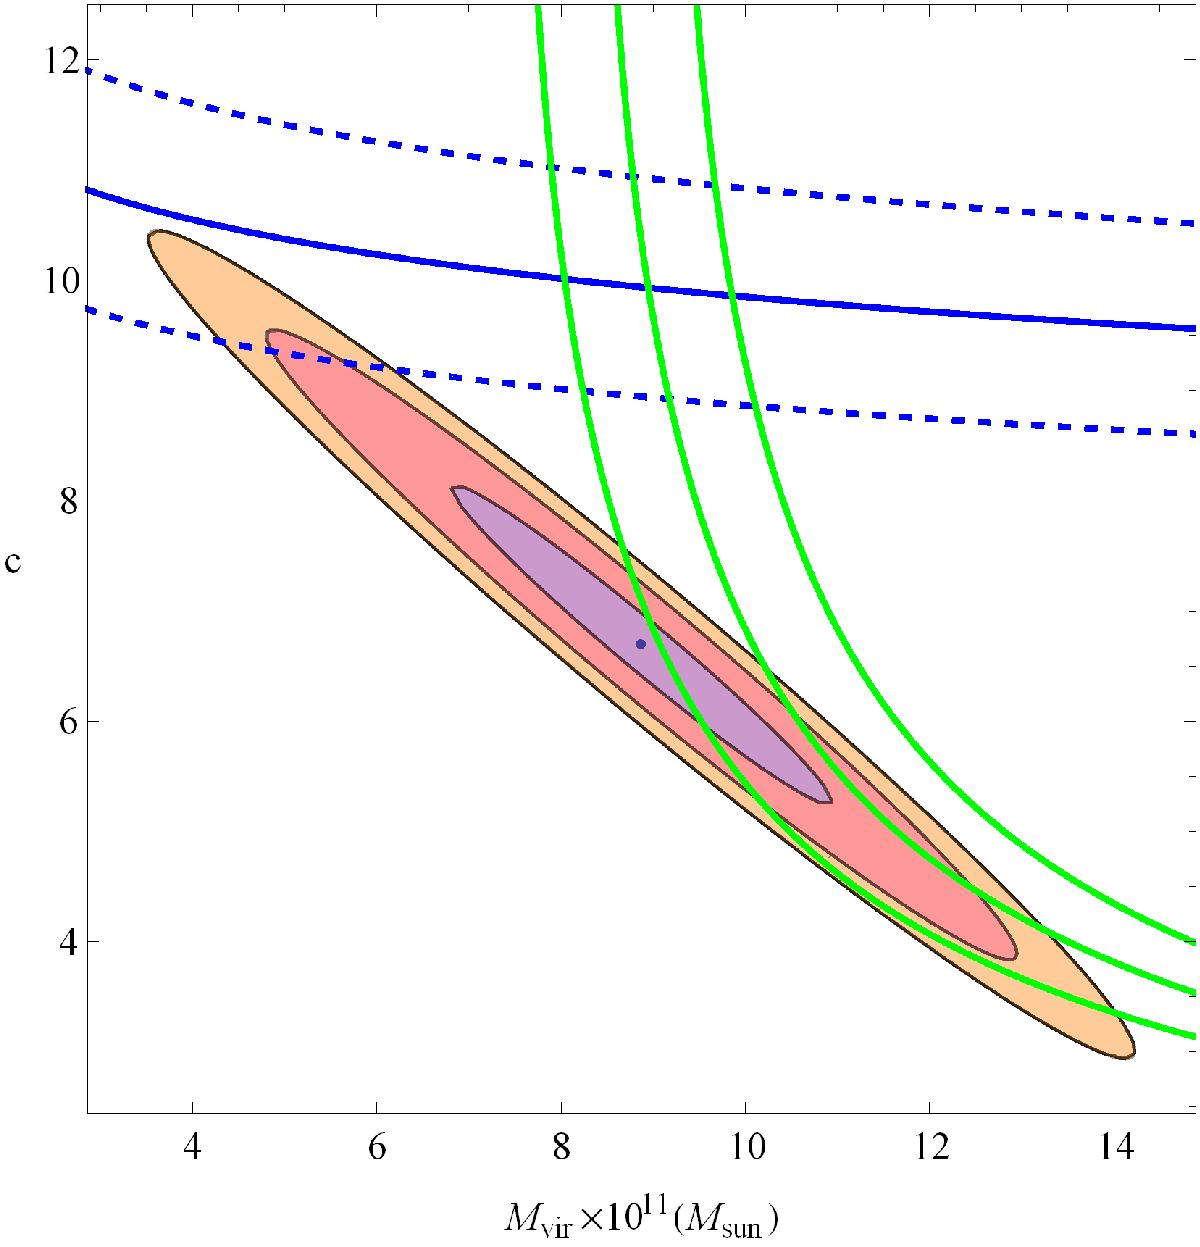
NFW case: the 1, 2, 3σ (purple region, red region and orange region, respectively) confidence ellipses for the global best-fit parameters. The blue solid line shows the c−Mvir relation from numerical simulations, the dashed blue lines show its 10 percent uncertainty. The green region shows the c−Mvir relation from the local density values obtained by the Salucci et al. (2010) method taking the 10 percent uncertainty into account.
Current usage metrics show cumulative count of Article Views (full-text article views including HTML views, PDF and ePub downloads, according to the available data) and Abstracts Views on Vision4Press platform.
Data correspond to usage on the plateform after 2015. The current usage metrics is available 48-96 hours after online publication and is updated daily on week days.
Initial download of the metrics may take a while.