Fig. 9
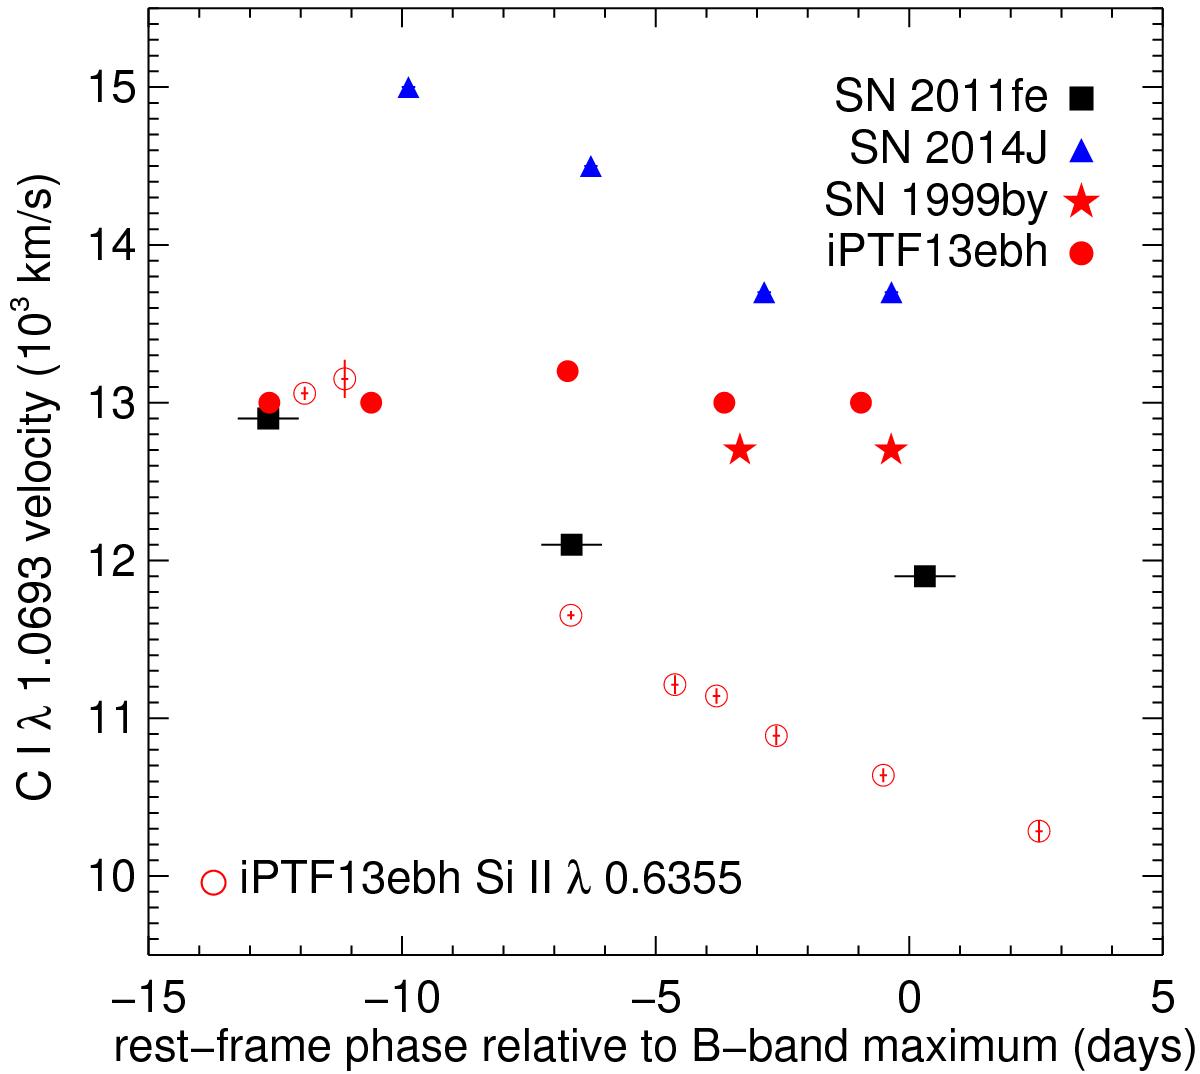
Time evolution of the C iλ1.0693 μm velocities for the four supernovae with C i detections. Various symbols represent different objects as noted. Blue, black, and red symbols represent SNe Ia with optical light-curve decline rates in the range Δm15(B) < 1.0, 1.0 < Δm15(B) < 1.6, Δm15(B) > 1.6, respectively. The velocities are taken from the C i velocity representing the base of the line-forming region in the best-fit SYNAPPS models. The Si iiλ0.6355 μm velocity of iPTF13ebh is also plotted for comparison.
Current usage metrics show cumulative count of Article Views (full-text article views including HTML views, PDF and ePub downloads, according to the available data) and Abstracts Views on Vision4Press platform.
Data correspond to usage on the plateform after 2015. The current usage metrics is available 48-96 hours after online publication and is updated daily on week days.
Initial download of the metrics may take a while.