Fig. 8
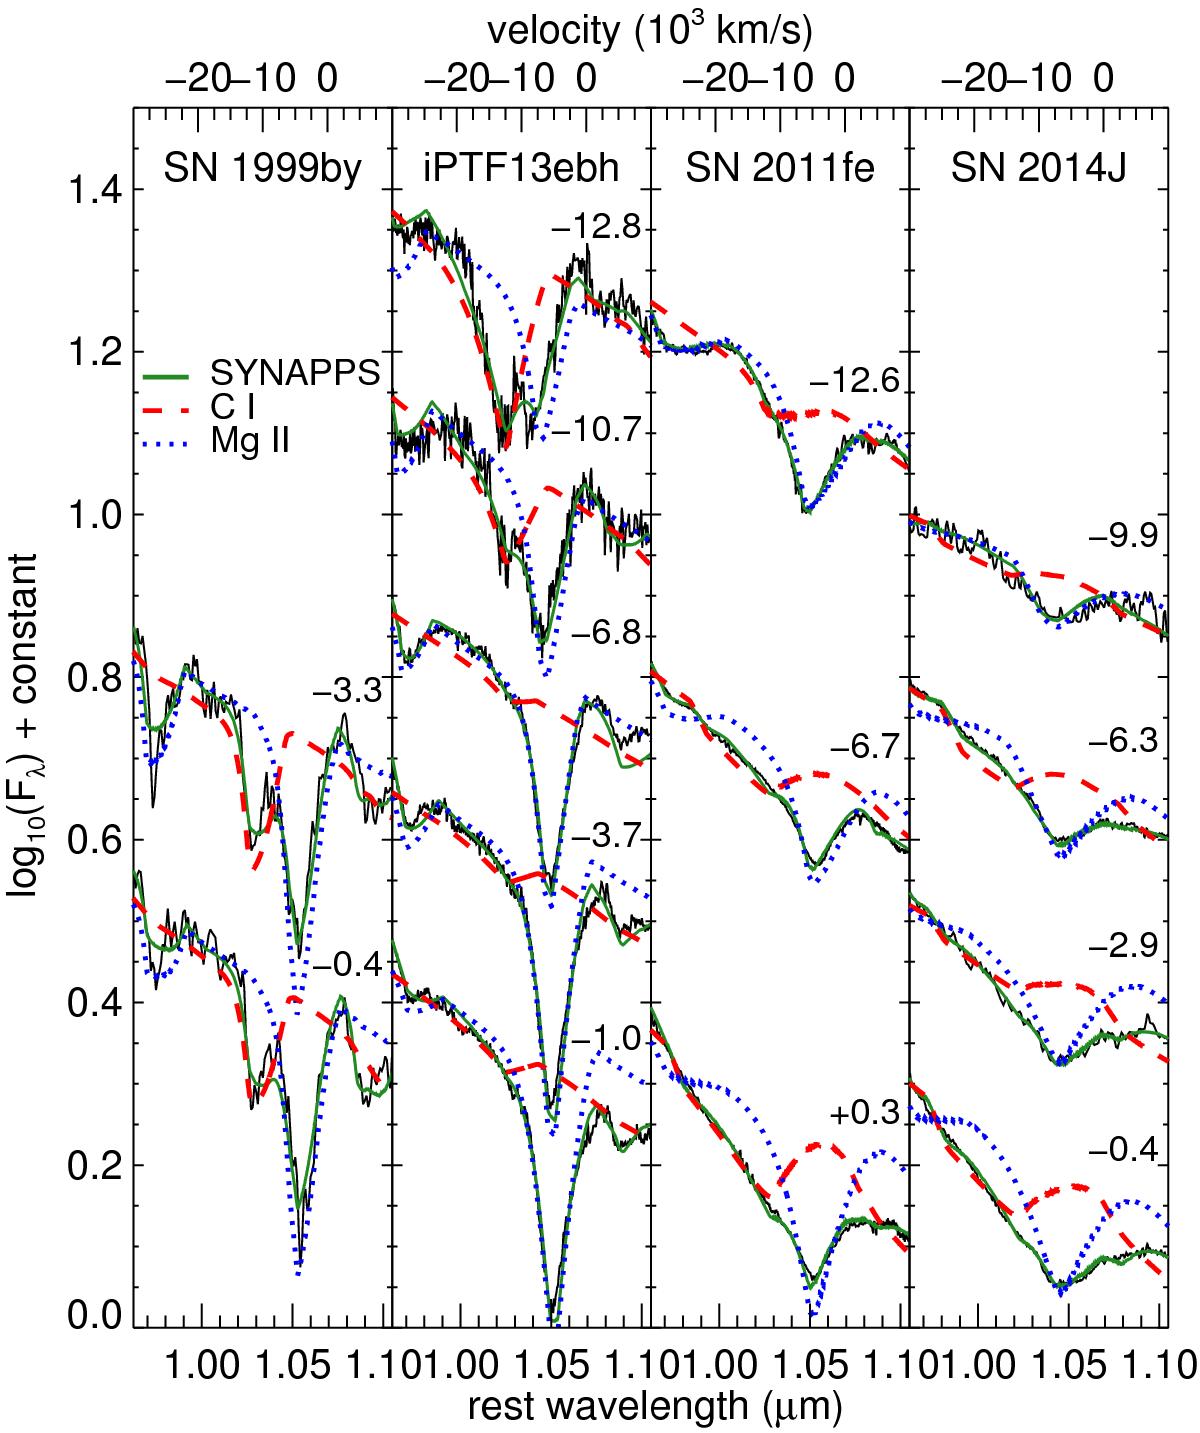
NIR C iλ1.0693 μm line for four SNe Ia with NIR C i detection. Each panel presents the time evolution for each supernova with the phase relative to B maximum labeled for each spectrum. The solid green curves are the best-fit SYNAPPS models. Dashed red and dotted blue curves show the isolated contributions from C iλ1.0693 μm and Mg iiλ1.0927 μm, respectively. The velocity axes on the top are plotted with respect to the C iλ1.0693 μm line.
Current usage metrics show cumulative count of Article Views (full-text article views including HTML views, PDF and ePub downloads, according to the available data) and Abstracts Views on Vision4Press platform.
Data correspond to usage on the plateform after 2015. The current usage metrics is available 48-96 hours after online publication and is updated daily on week days.
Initial download of the metrics may take a while.