Fig. 7
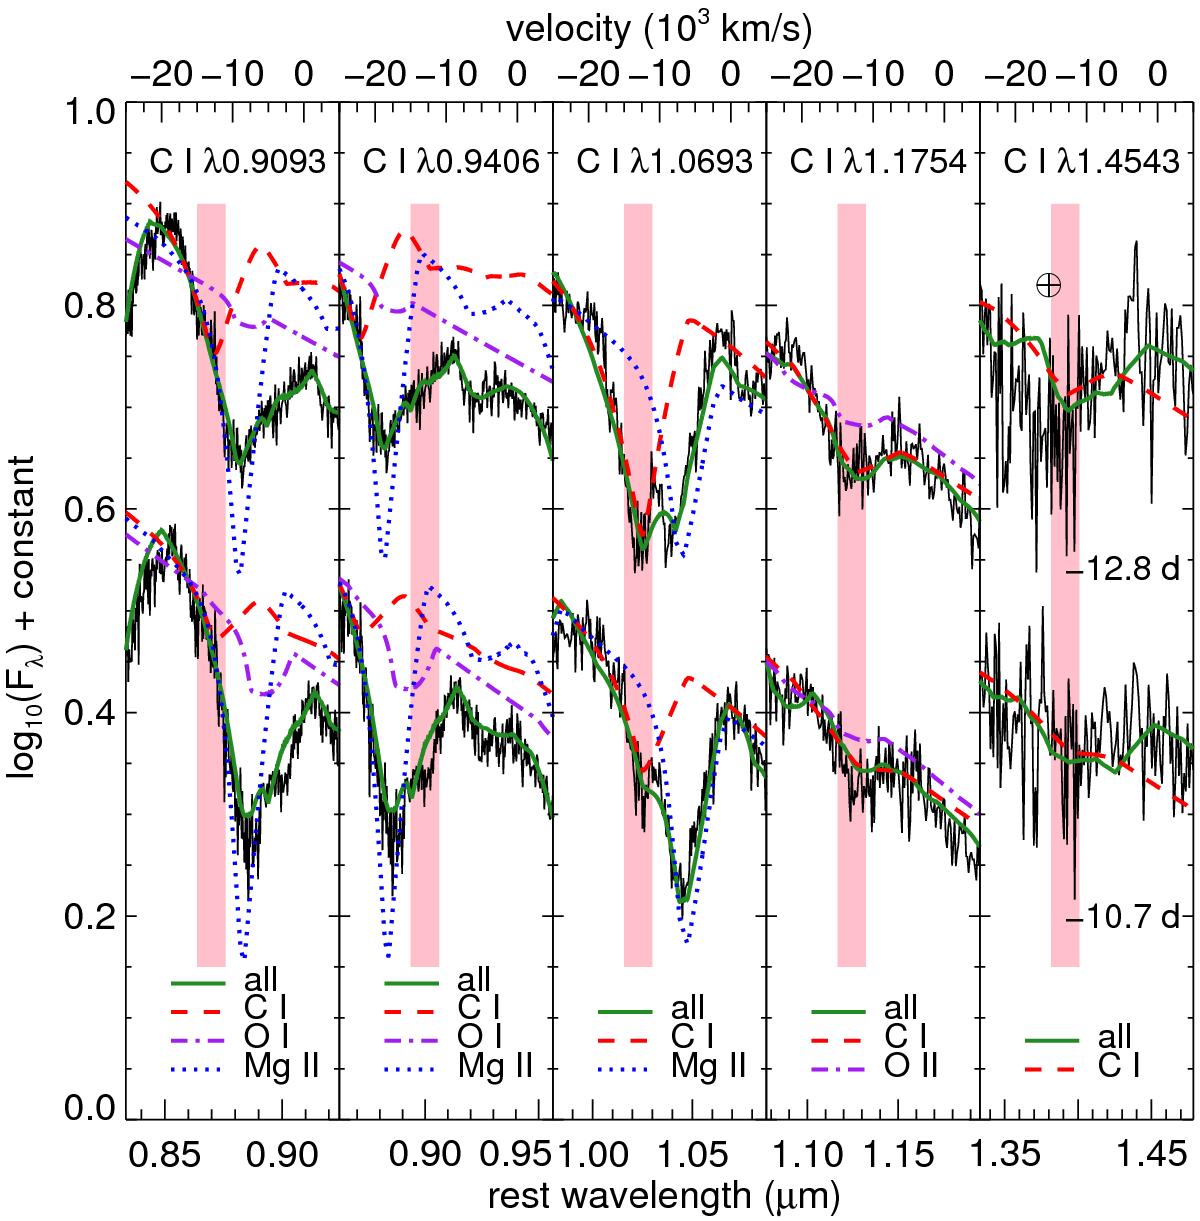
NIR C i lines of iPTF13ebh in the two earliest spectra. The phase relative to the time of B maximum is labeled for each spectrum. The best-fit SYNAPPS models for both epochs yielded a velocity of 13 000 km s-1 for C i, representing the base of the line-forming region. The best fit as a whole and the isolated contributions from the main ions responsible for the spectral features in each wavelength region are plotted. A vertical band marks this velocity for each C i line. C iλ1.4543 μm for iPTF13ebh is located near the region of strong telluric absorption, which is identified with an Earth symbol.
Current usage metrics show cumulative count of Article Views (full-text article views including HTML views, PDF and ePub downloads, according to the available data) and Abstracts Views on Vision4Press platform.
Data correspond to usage on the plateform after 2015. The current usage metrics is available 48-96 hours after online publication and is updated daily on week days.
Initial download of the metrics may take a while.