Free Access
Fig. 3
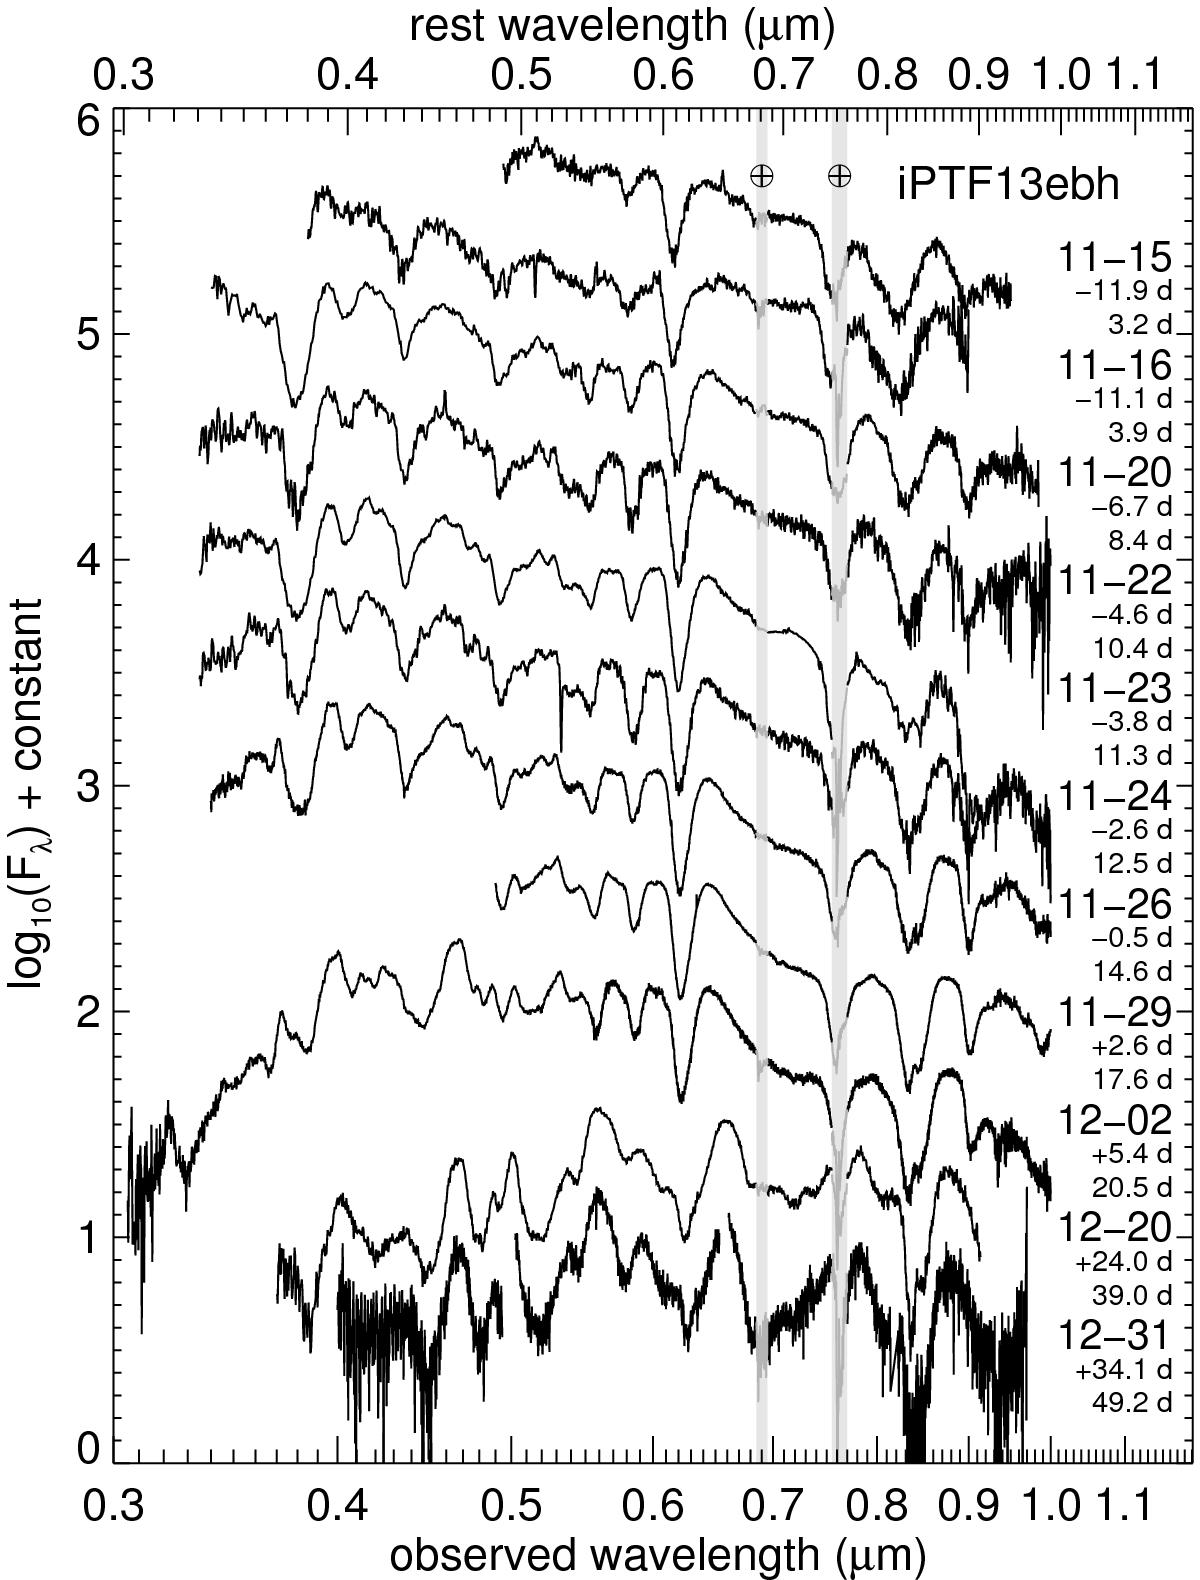
Optical spectra of iPTF13ebh. The UT date of observation, phase relative to explosion and phase relative to B-band maximum are labeled for each spectrum. The gray vertical bands mark the regions of the strongest telluric absorptions.
Current usage metrics show cumulative count of Article Views (full-text article views including HTML views, PDF and ePub downloads, according to the available data) and Abstracts Views on Vision4Press platform.
Data correspond to usage on the plateform after 2015. The current usage metrics is available 48-96 hours after online publication and is updated daily on week days.
Initial download of the metrics may take a while.