Fig. 2
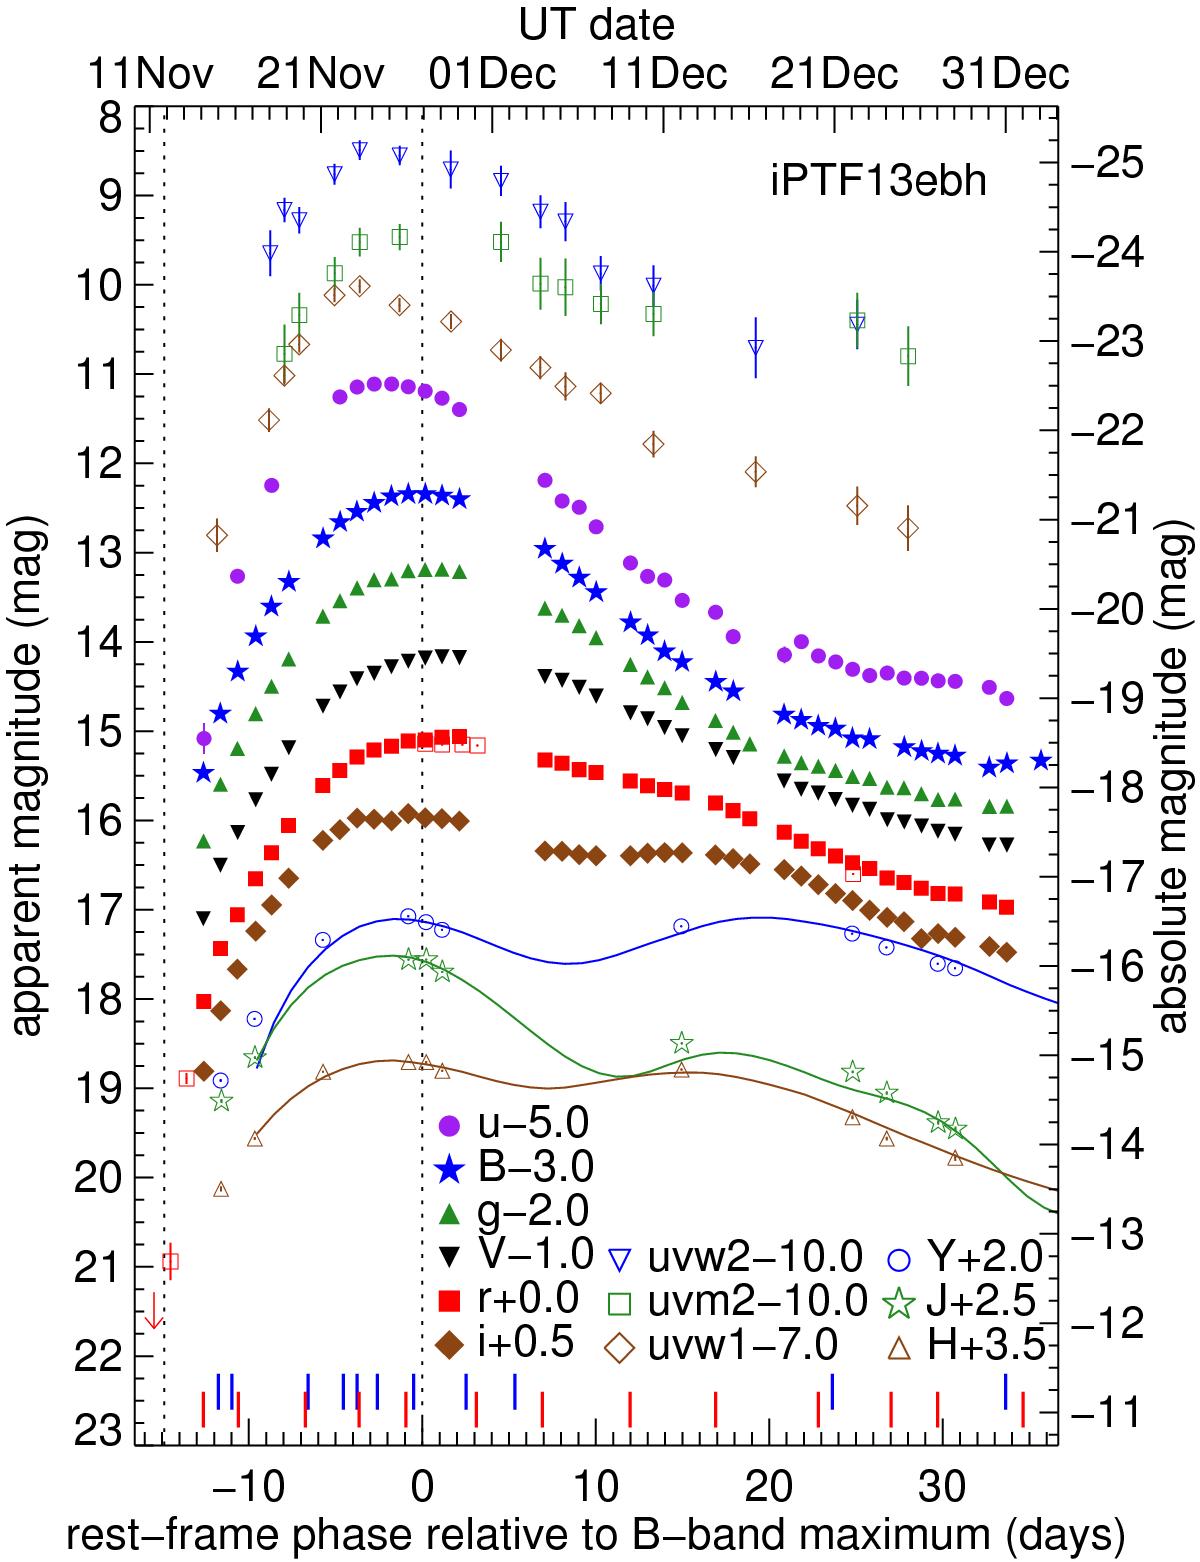
UV, optical, and NIR light curves of iPTF13ebh. The uvw2, uvm2, and uvw1 light curves are obtained with UVOT on Swift; the uBVgri light curves are obtained with the e2v imager on Swope; and the YJH light curves are obtained with RetroCam on du Pont. All of these are without host subtractions. For the r-band light curve, open red square symbols represent host-subtracted r-band data from P48. A downward arrow marks the date of a non-detection image from P48 down to a magnitude limit of 21.7 mag. SNooPy fits (Burns et al. 2011) are plotted for the more sparsely sampled NIR light curves. Blue and red vertical dash lines mark the dates when the optical and NIR spectra are taken, respectively. Two black vertical dotted lines are drawn at the inferred time of explosion and time of B-band maximum. The absolute magnitude is computed using a distance modulus of 33.63, derived from the host recession velocity of Woods et al. (2006).
Current usage metrics show cumulative count of Article Views (full-text article views including HTML views, PDF and ePub downloads, according to the available data) and Abstracts Views on Vision4Press platform.
Data correspond to usage on the plateform after 2015. The current usage metrics is available 48-96 hours after online publication and is updated daily on week days.
Initial download of the metrics may take a while.