Fig. 14
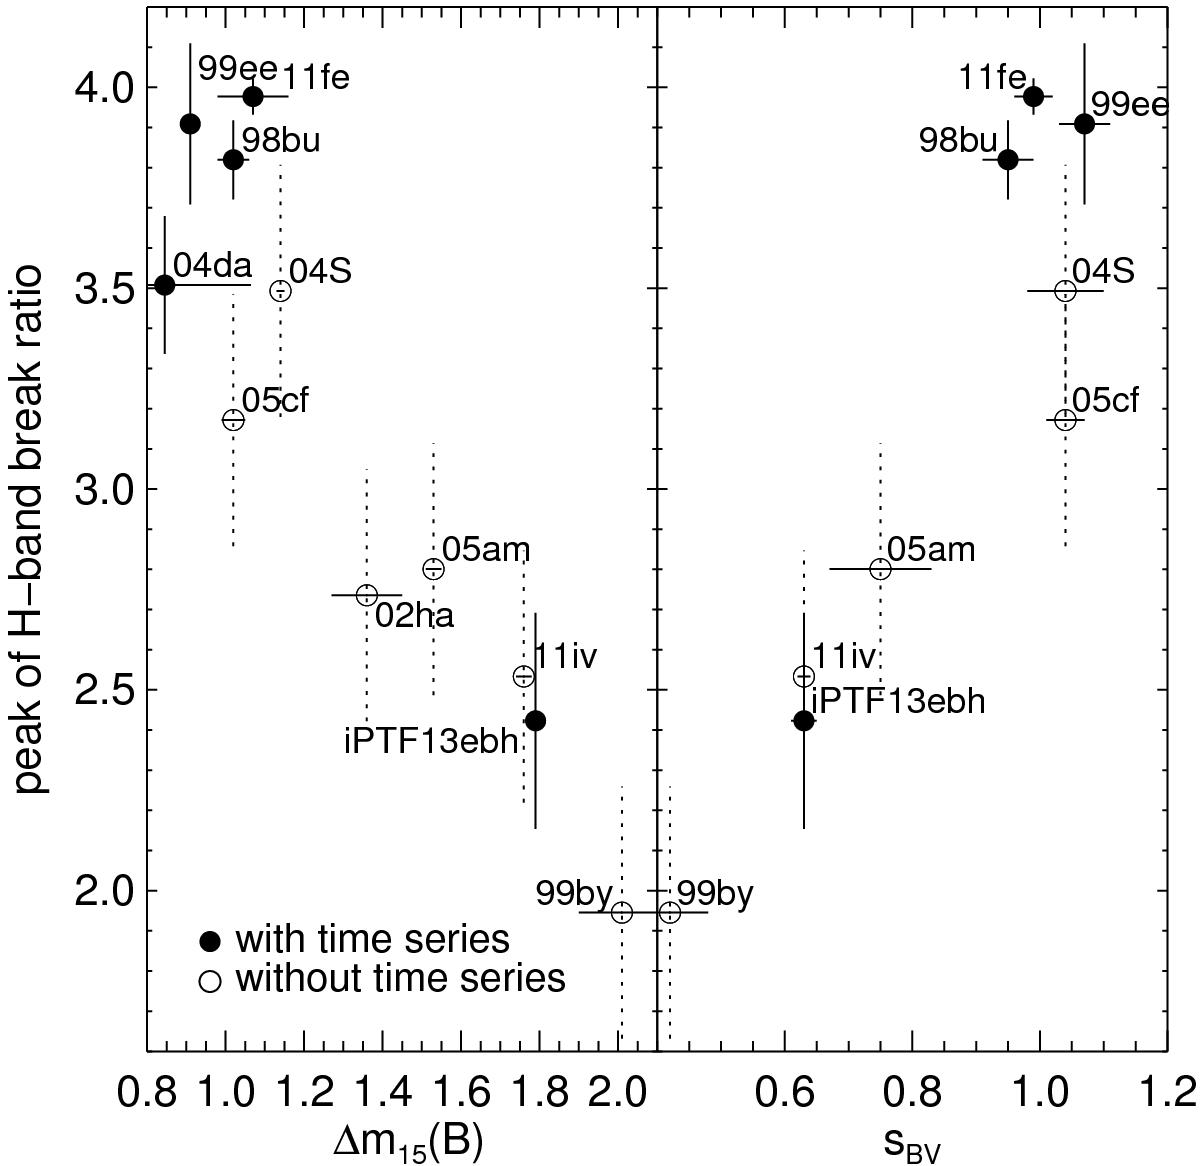
Peak of H-band break ratio versus the optical light-curve decline rate Δm15(B) and color stretch sBV. SNe Ia with two or more observations in the post-peak decline are plotted with filled circles and solid error bars, while the rest are plotted with open circles and dotted error bars. The correlations for both parameters are strong.
Current usage metrics show cumulative count of Article Views (full-text article views including HTML views, PDF and ePub downloads, according to the available data) and Abstracts Views on Vision4Press platform.
Data correspond to usage on the plateform after 2015. The current usage metrics is available 48-96 hours after online publication and is updated daily on week days.
Initial download of the metrics may take a while.