Fig. 13
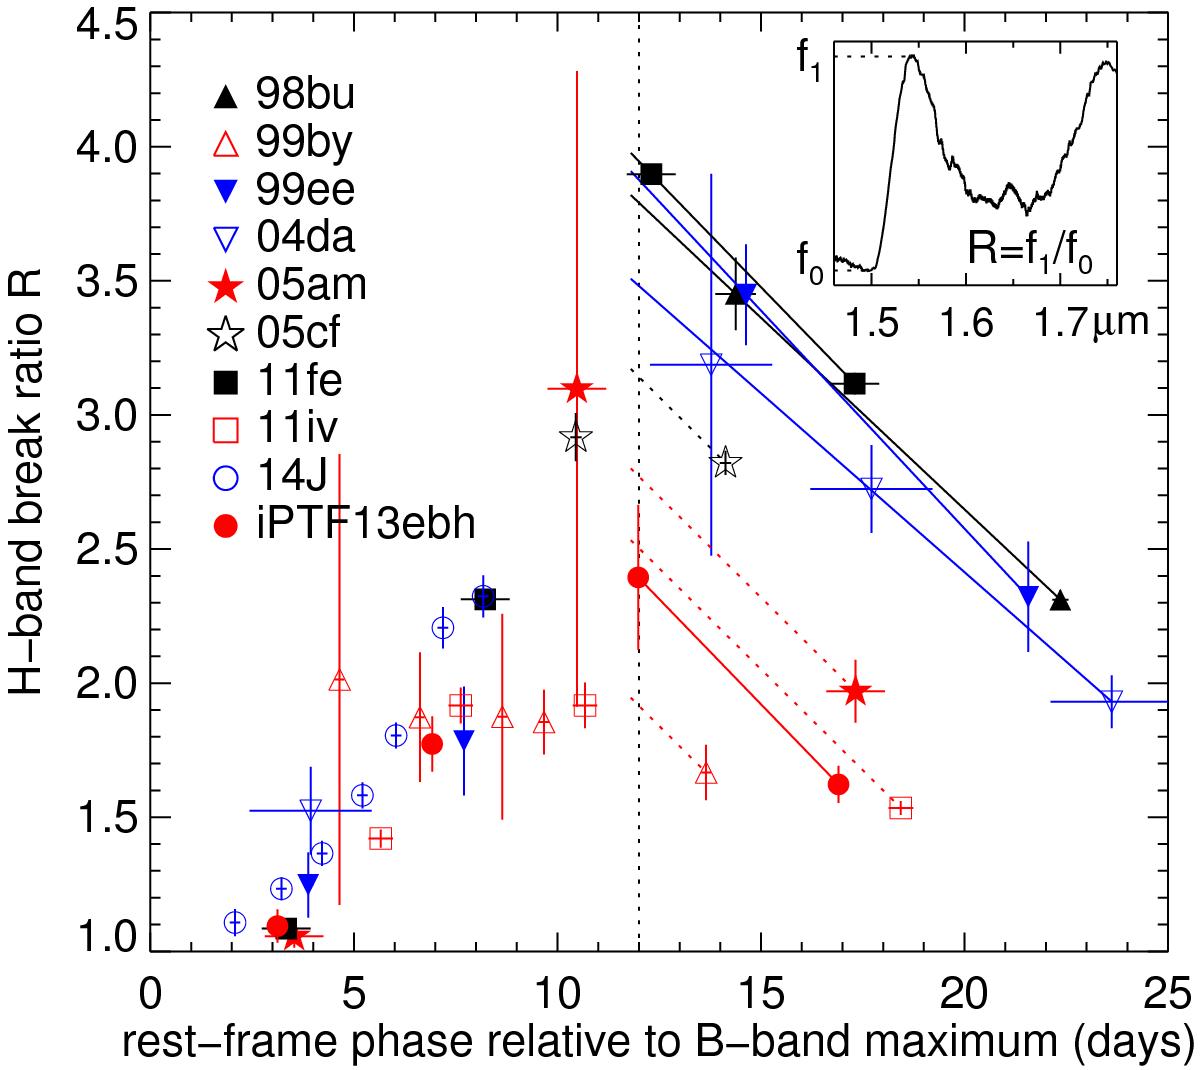
Time evolution of the H-band break ratio. Different symbols represent measurements of different supernovae, as noted in the plot. Blue, black, and red symbols represent SNe Ia with optical light-curve decline rates in the range Δm15(B) < 1.0, 1.0 < Δm15(B) < 1.6, Δm15(B) > 1.6, respectively. The inset illustrates the definition of the H-band break ratio with the spectrum of SN 2011fe at 12 days past maximum. The linear fits to the post-peak decline are plotted as solid lines when more than two data points are available and as dashed lines when only a single data point is available and the error-weighted mean decline rate is assumed. There is a wide range of peak H-band break ratios, but the post-peak declines are remarkably uniform.
Current usage metrics show cumulative count of Article Views (full-text article views including HTML views, PDF and ePub downloads, according to the available data) and Abstracts Views on Vision4Press platform.
Data correspond to usage on the plateform after 2015. The current usage metrics is available 48-96 hours after online publication and is updated daily on week days.
Initial download of the metrics may take a while.