Free Access
Fig. 12
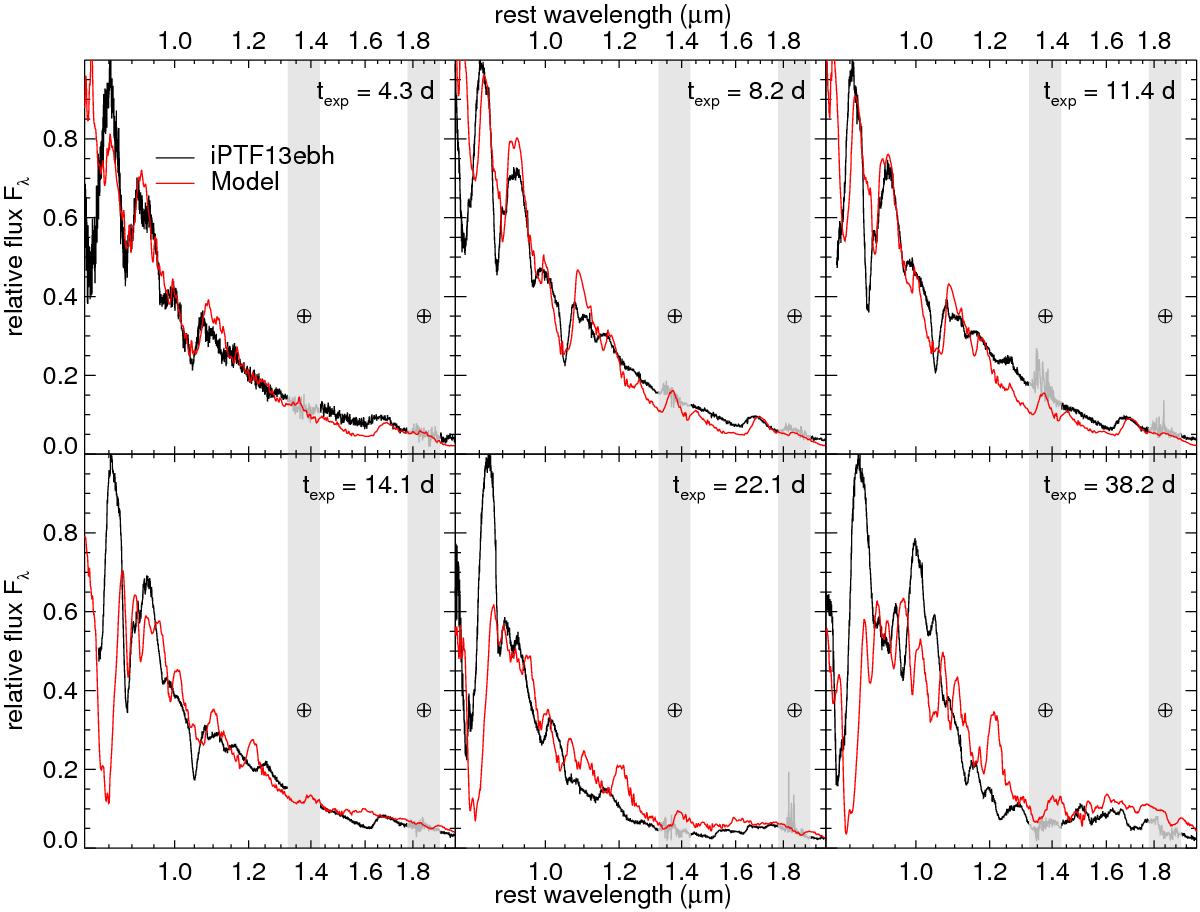
Comparison between the NIR spectra of iPTF13ebh and the ρtr = 16 × 106 g cm-3 model spectra. The phases of the observed spectra are noted in the plot. These are relative to the explosion date, as inferred from the early-time r-band light curve. The model spectra are computed at these epochs.
Current usage metrics show cumulative count of Article Views (full-text article views including HTML views, PDF and ePub downloads, according to the available data) and Abstracts Views on Vision4Press platform.
Data correspond to usage on the plateform after 2015. The current usage metrics is available 48-96 hours after online publication and is updated daily on week days.
Initial download of the metrics may take a while.