Fig. 10
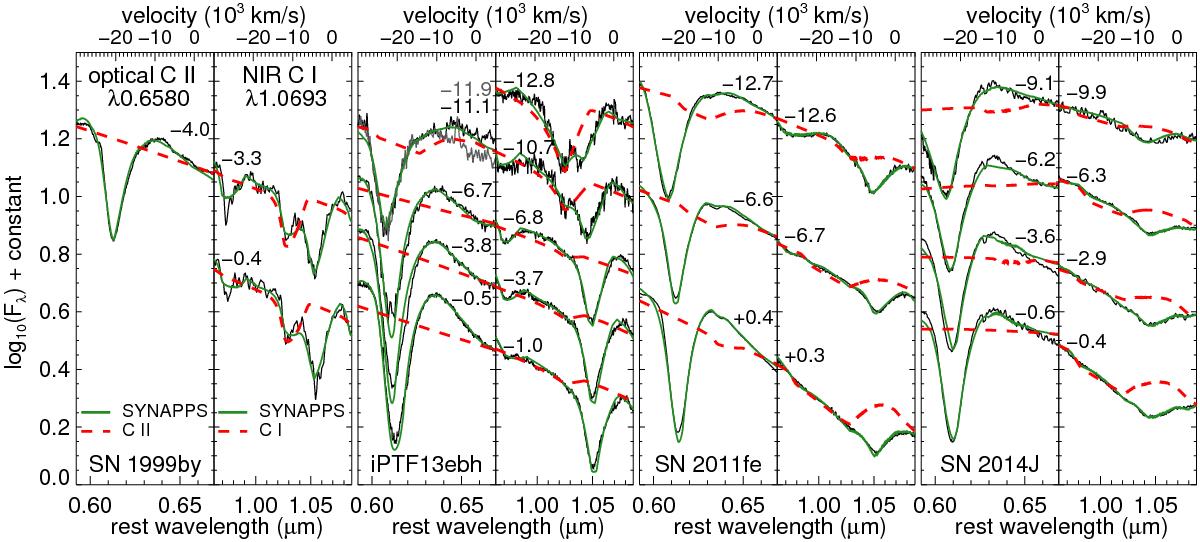
Comparison between the optical C iiλ0.6580 μm and the NIR C iλ1.0693 μm lines of the four SNe Ia with C i detections. The optical/NIR pair is selected such that the spectra are close in phase for each SN Ia. The phases relative to B maximum are labeled. The velocity axes are plotted with respect to each carbon line. Since the two earliest optical spectra of iPTF13ebh are taken less than one day apart and have identical Si ii/C ii line profiles, they are plotted together. The SYNAPPS fit was done on the day −11.1 spectrum. Except at the very early epoch of SN 2011fe, the NIR C i line is always stronger than the optical C ii line.
Current usage metrics show cumulative count of Article Views (full-text article views including HTML views, PDF and ePub downloads, according to the available data) and Abstracts Views on Vision4Press platform.
Data correspond to usage on the plateform after 2015. The current usage metrics is available 48-96 hours after online publication and is updated daily on week days.
Initial download of the metrics may take a while.