Fig. 4
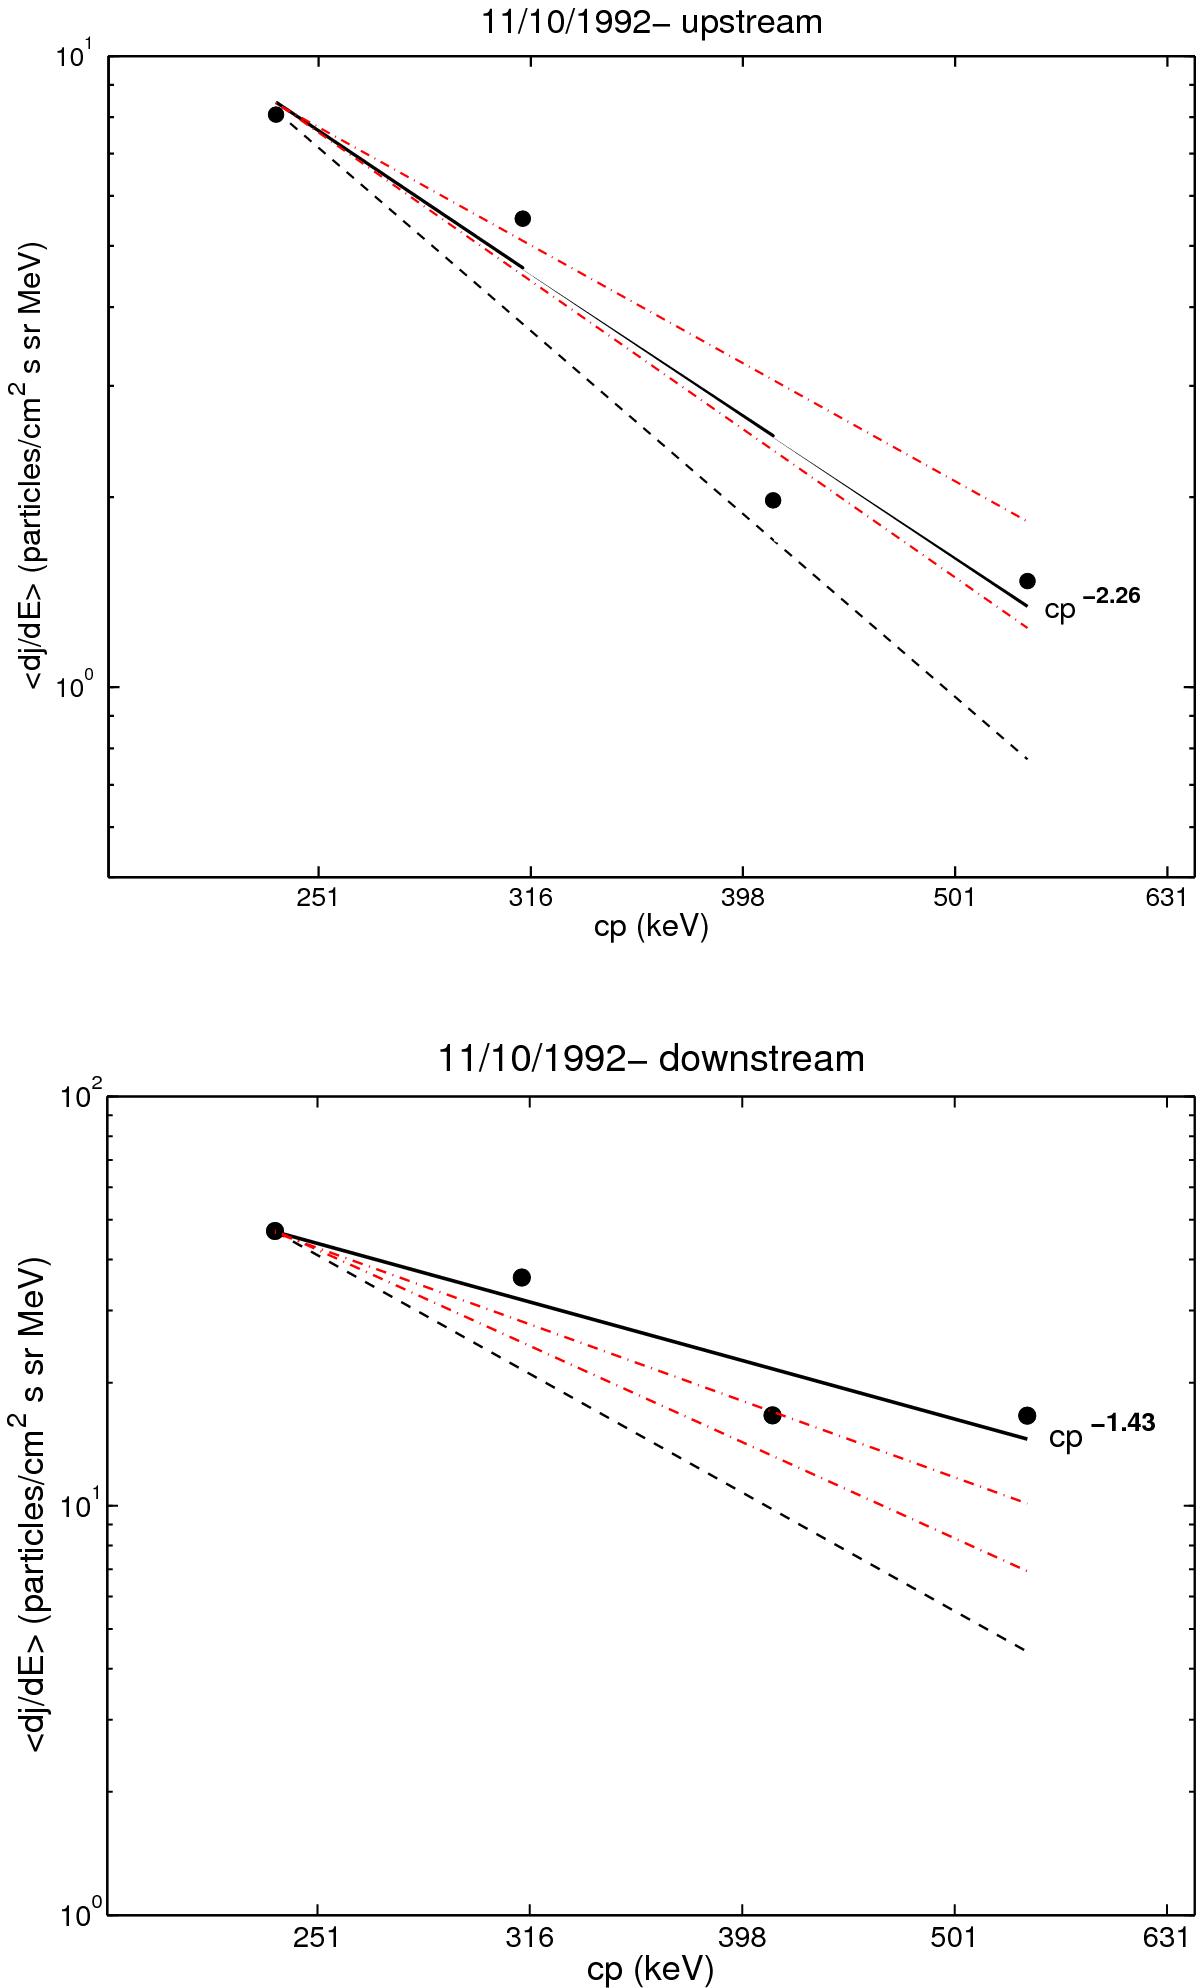
Energy spectra (filled circles) for the CIR shock of 11/10/1992 calculated upstream (top panel) and downstream (bottom panel). The thick solid line represents the best power-law fit. The black dashed lines indicate the DSA prediction and the red dash-dotted lines indicate the power-law behaviour predicted by SSA considering the minimum and the maximum values of α found from the electron time profiles (see text).
Current usage metrics show cumulative count of Article Views (full-text article views including HTML views, PDF and ePub downloads, according to the available data) and Abstracts Views on Vision4Press platform.
Data correspond to usage on the plateform after 2015. The current usage metrics is available 48-96 hours after online publication and is updated daily on week days.
Initial download of the metrics may take a while.