Free Access
Fig. 2
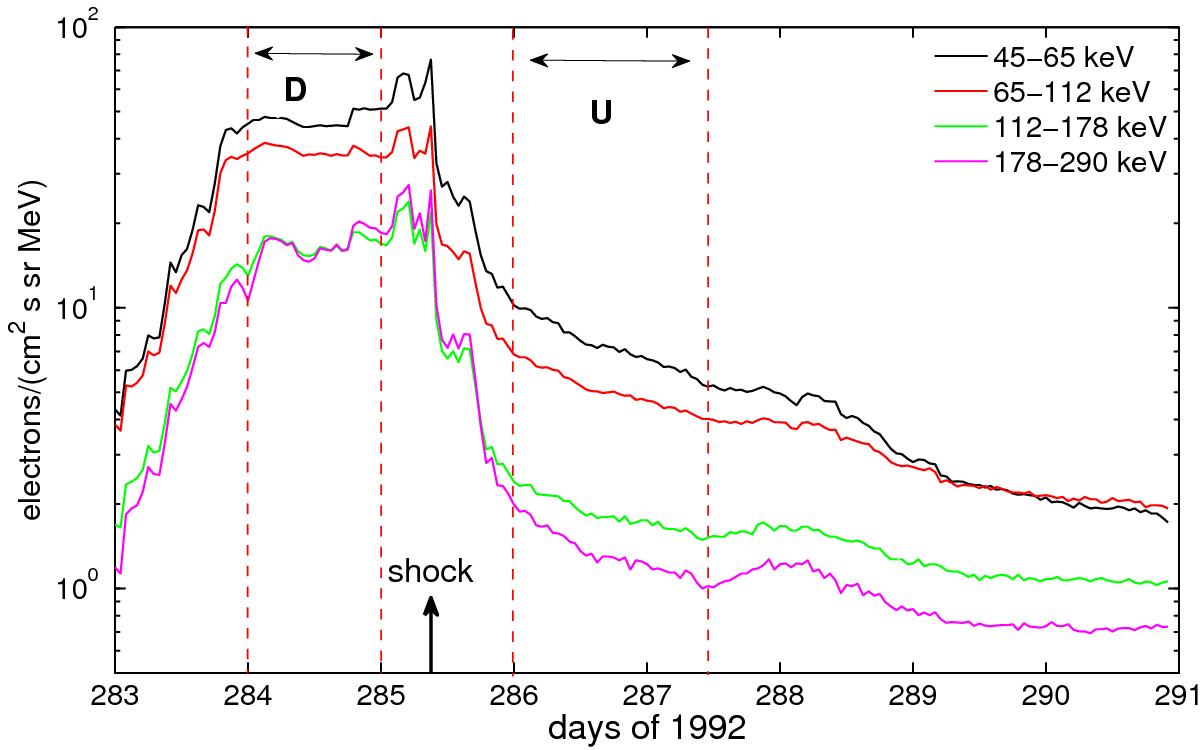
Hourly resolution electron flux measured by the Ulysses spacecraft at the CIR shock of 11/10/1992. The shock position is indicated by the vertical thick arrow. The vertical red dashed lines delimit the regions upstream and downstream where an average flux ⟨ dj/ dE ⟩ has been computed.
Current usage metrics show cumulative count of Article Views (full-text article views including HTML views, PDF and ePub downloads, according to the available data) and Abstracts Views on Vision4Press platform.
Data correspond to usage on the plateform after 2015. The current usage metrics is available 48-96 hours after online publication and is updated daily on week days.
Initial download of the metrics may take a while.