Fig. 7
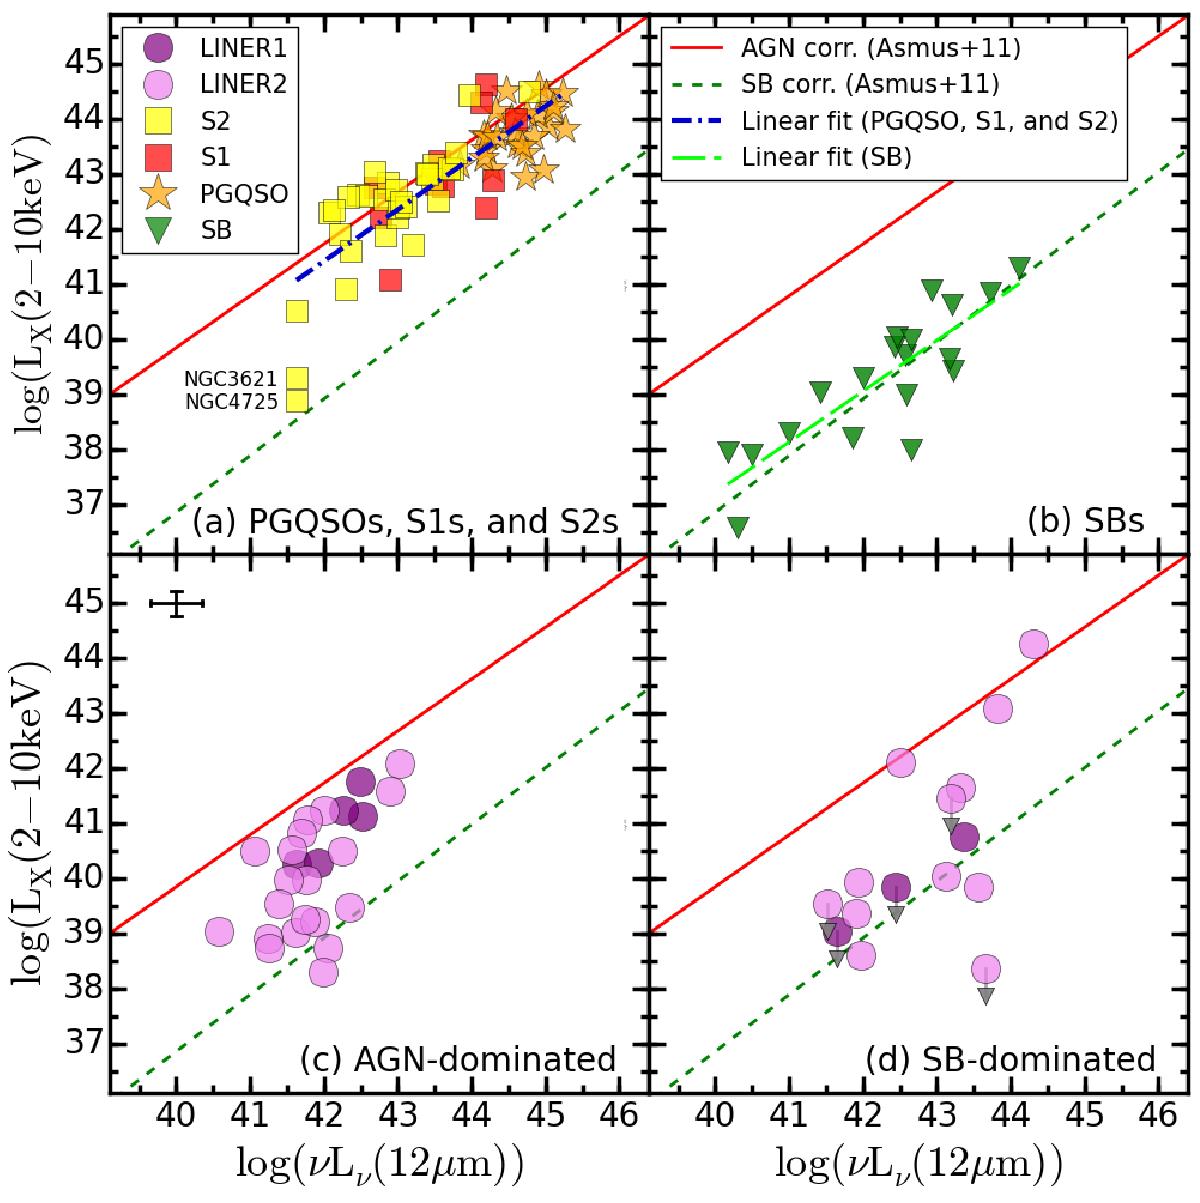
2−10 keV luminosity versus the 12 μm luminosity, both on logarithmic scale for PG QSOs, S1s and S2s a), SBs b), AGN-dominated LINERs c) and SB-dominated LINERs d). The continuous red and dashed-green lines show the best fit correlations for AGN and SBs, respectively, reported by Asmus et al. (2011). The typical error for these measurements is shown as a cross in the top left corner of panel c). Errors for the X-ray luminosity are estimated as 10% of its value. The dot-dashed blue line and long-dashed light green line show the linear fit for PG QSOs, S1s, and S2s and for SBs, respectively. Grey arrows mark objects with reported upper limits on the X-ray luminosity.
Current usage metrics show cumulative count of Article Views (full-text article views including HTML views, PDF and ePub downloads, according to the available data) and Abstracts Views on Vision4Press platform.
Data correspond to usage on the plateform after 2015. The current usage metrics is available 48-96 hours after online publication and is updated daily on week days.
Initial download of the metrics may take a while.