Fig. 6
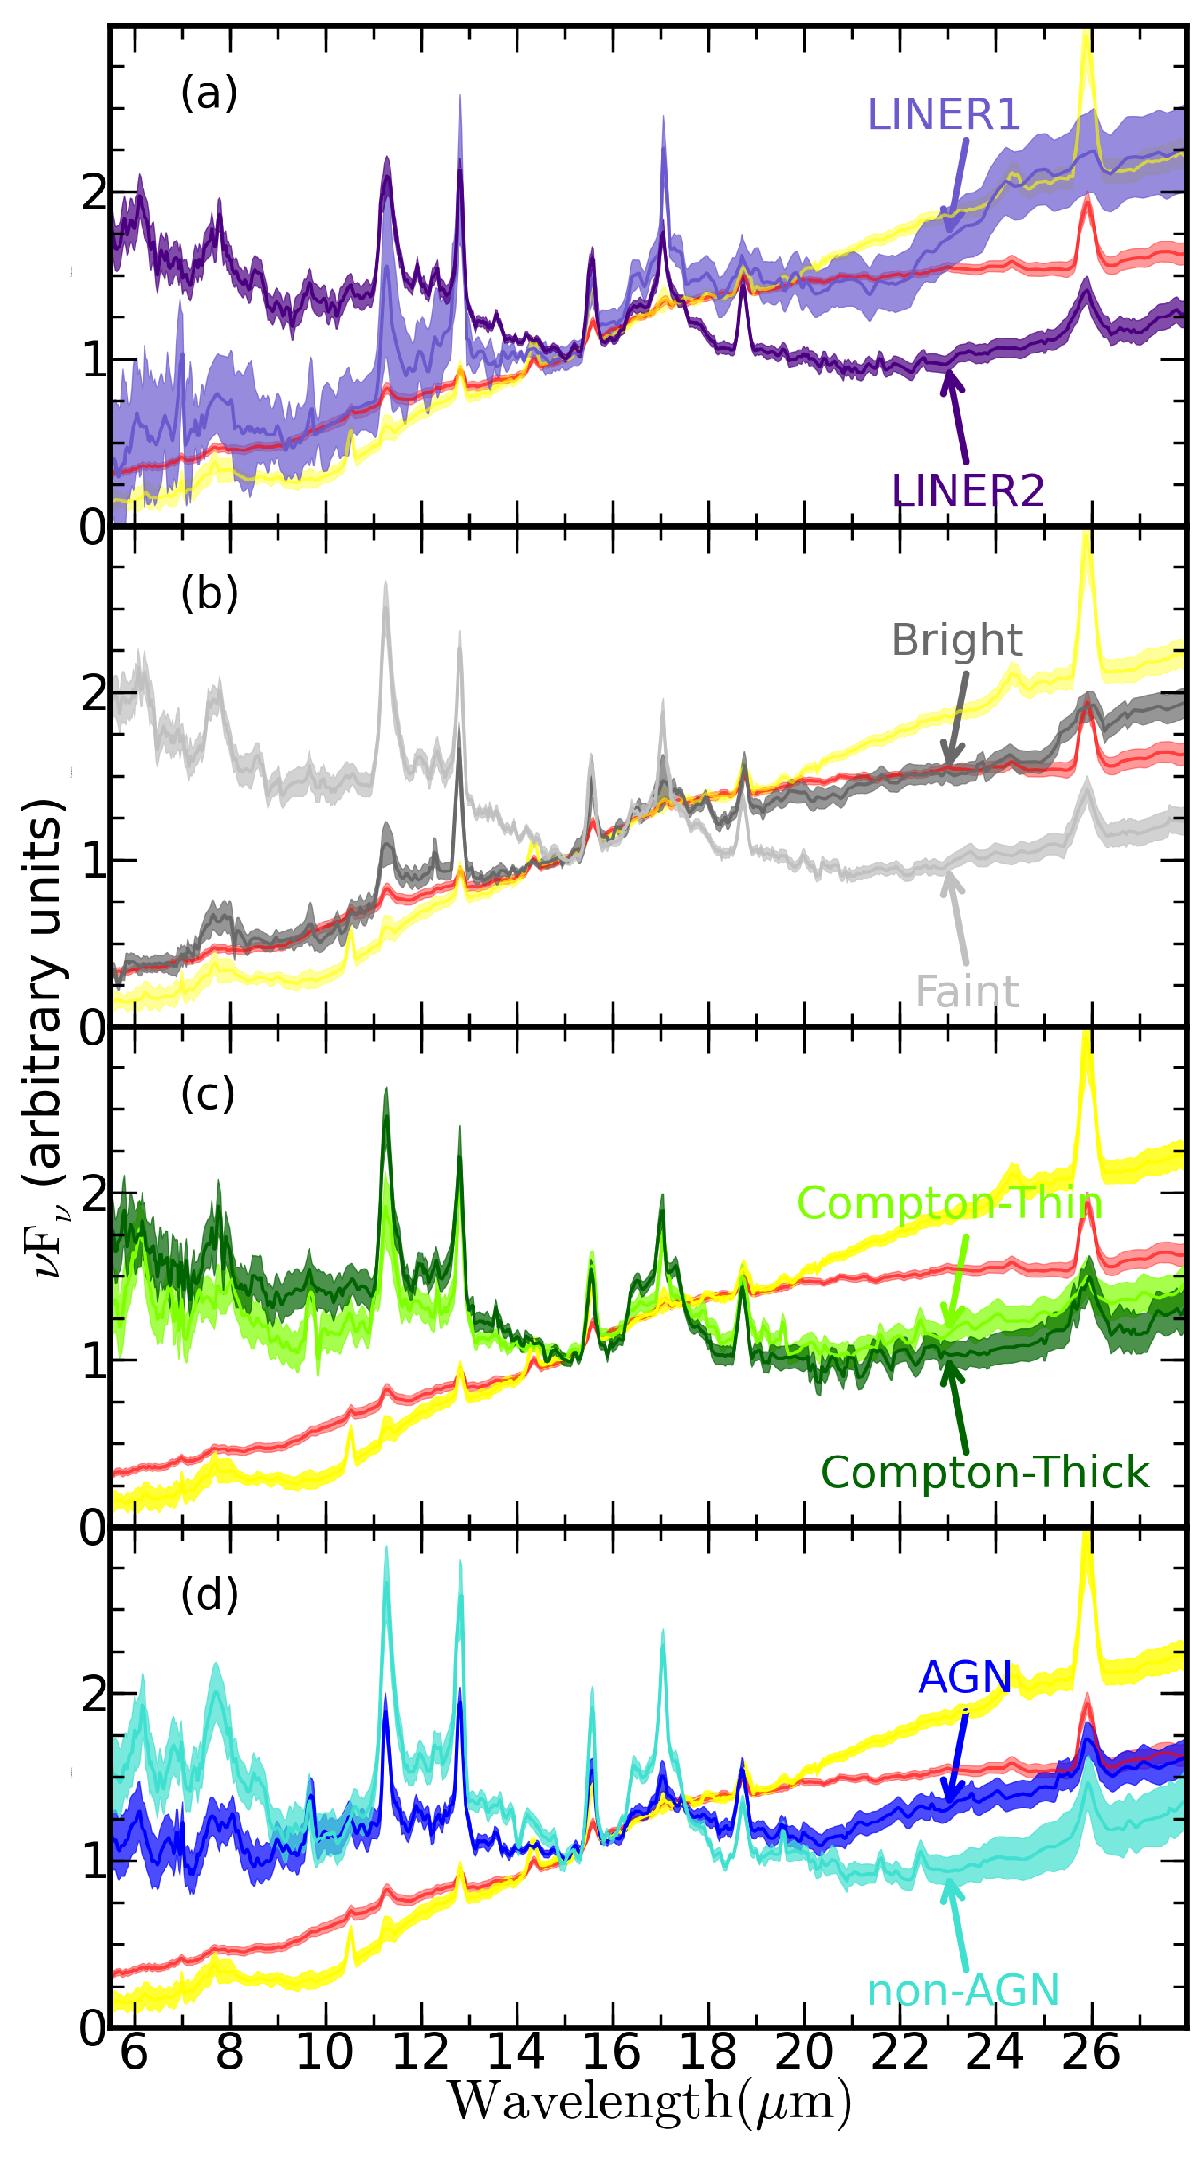
Average spectra of AGN-dominated LINERs according to different subclassifications. From top to bottom: a) LINER1s (light magenta) and LINER2s (dark magenta); b) bright LINERs (dark grey) and faint LINERs (light grey); c) Compton-thin (light green) and Compton-thick candidates (dark green); d) objects classified at X-rays as AGN (dark blue) and non-AGN candidates (cyan). The average spectra for S1s (red) and AGN-dominated S2s (yellow) are also shown for comparison purposes.
Current usage metrics show cumulative count of Article Views (full-text article views including HTML views, PDF and ePub downloads, according to the available data) and Abstracts Views on Vision4Press platform.
Data correspond to usage on the plateform after 2015. The current usage metrics is available 48-96 hours after online publication and is updated daily on week days.
Initial download of the metrics may take a while.