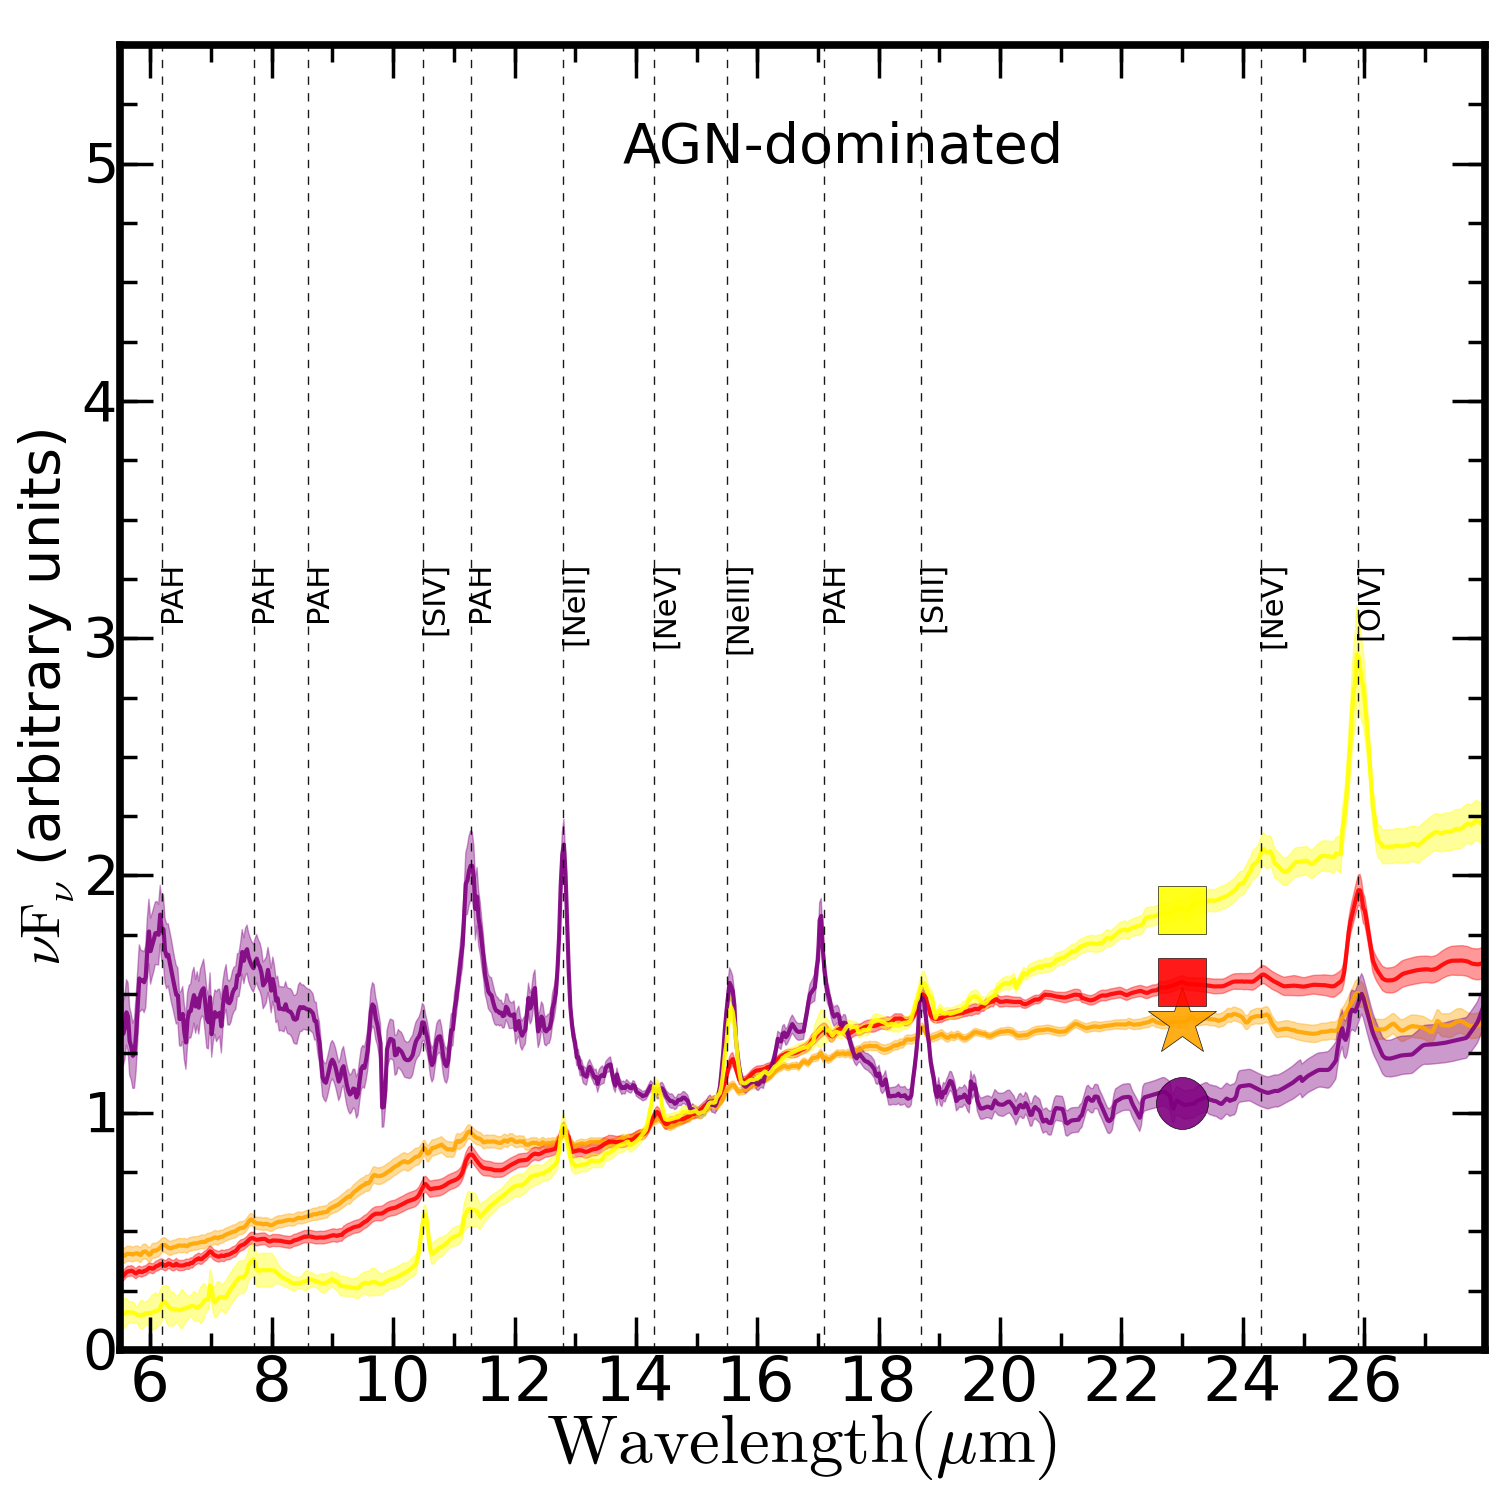
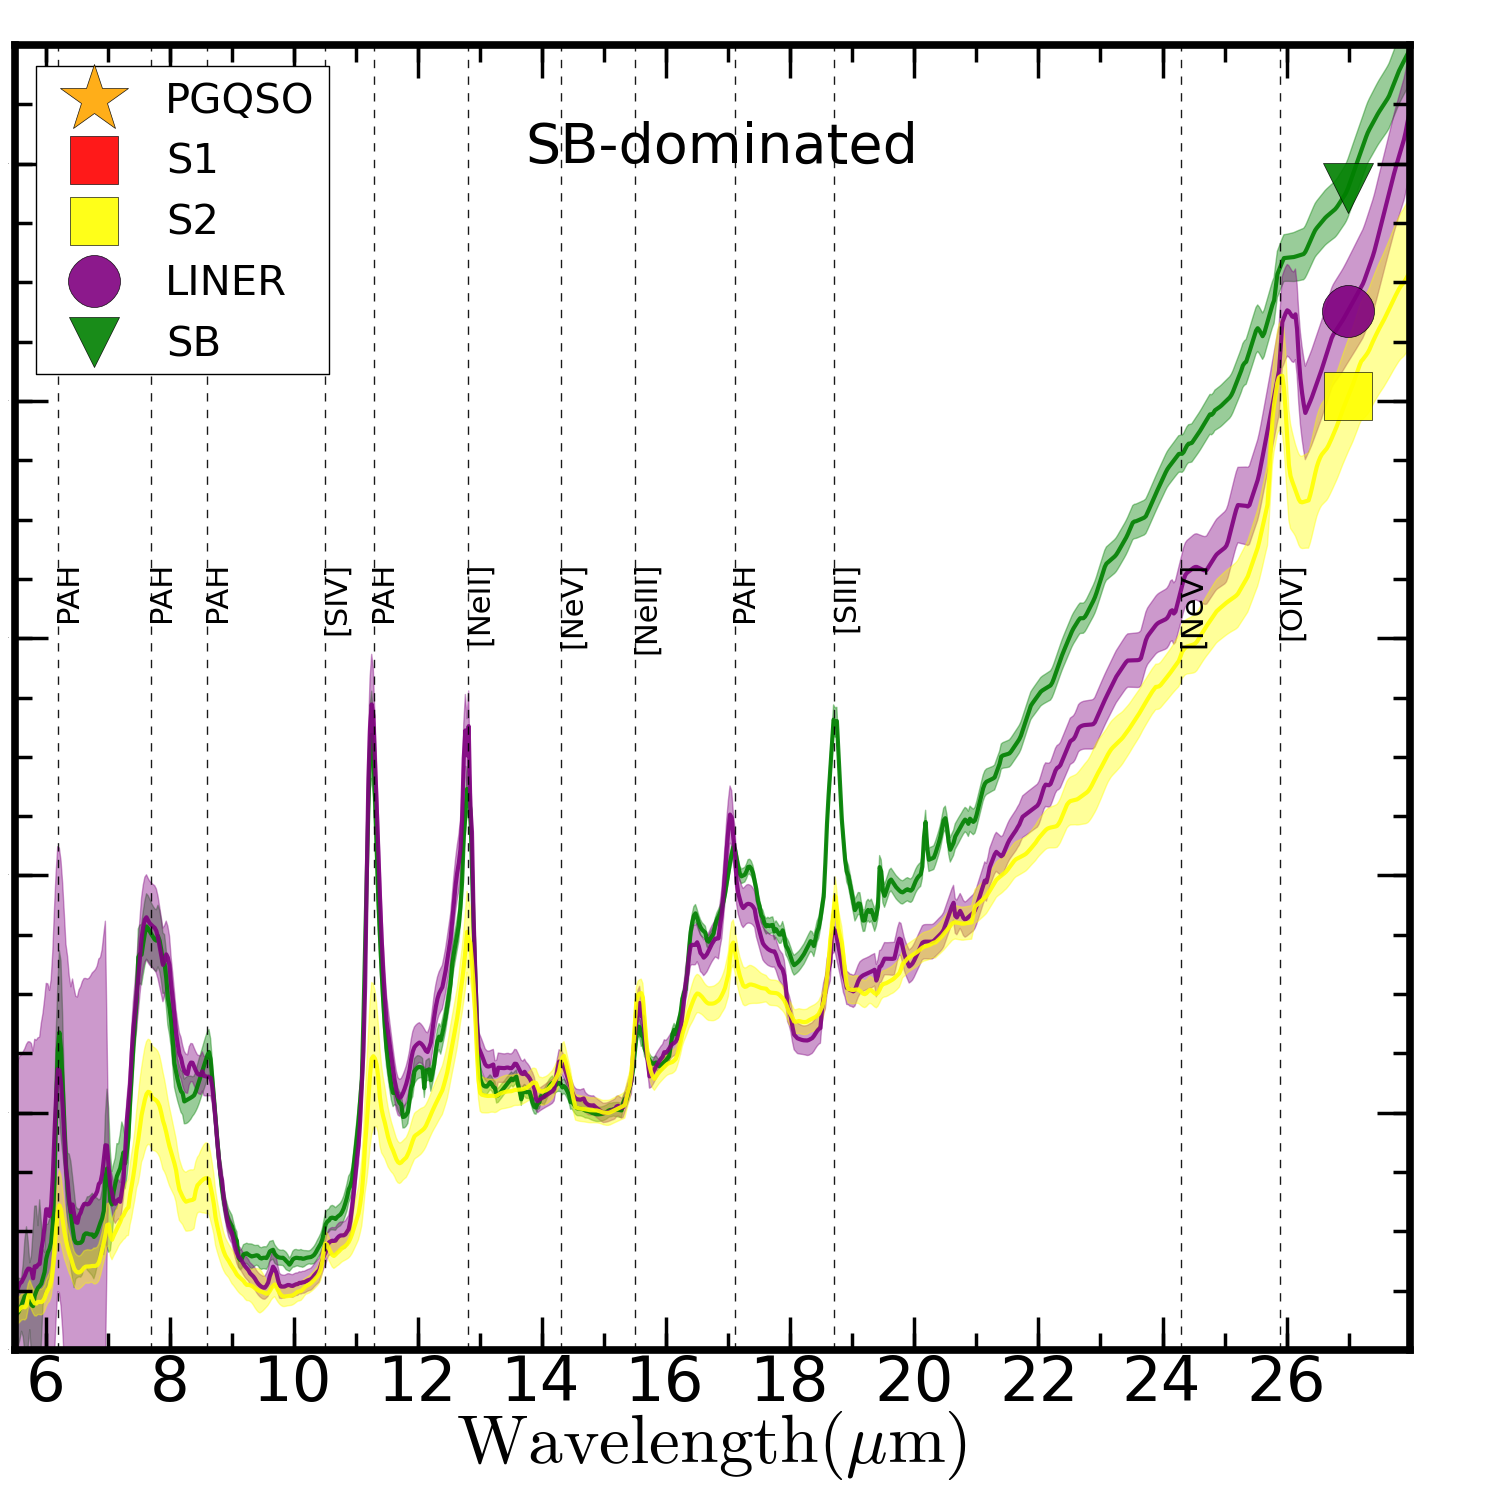
Fig. 5
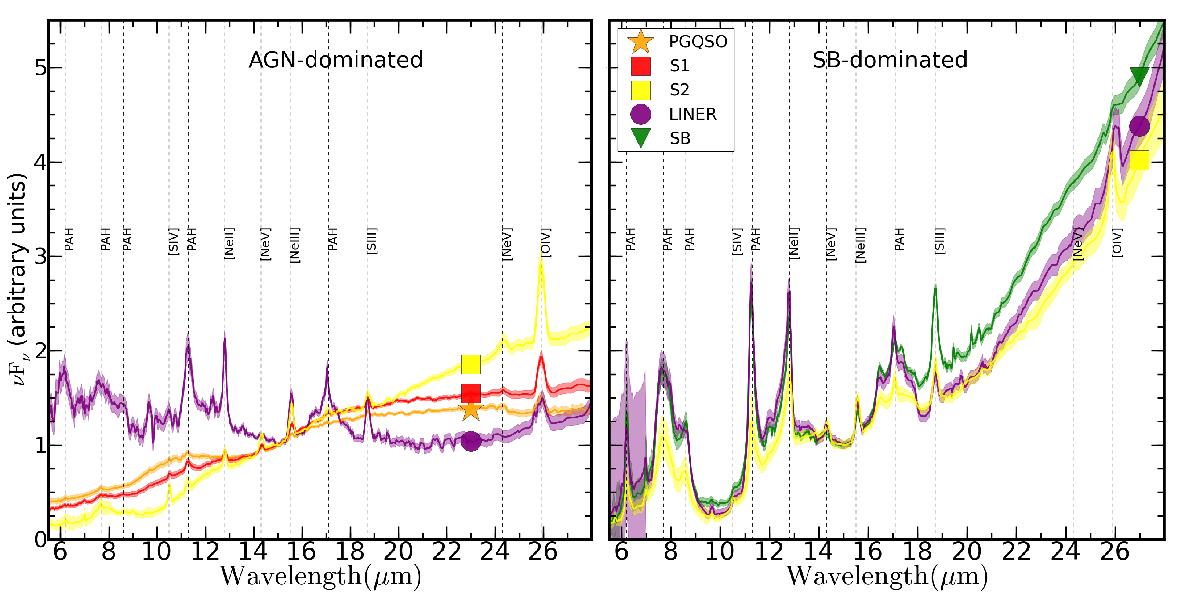
Left: average spectra for PG QSOs (orange), S1s (red), AGN-dominated S2s (yellow), and AGN-dominated LINERs (purple). Right: average spectra for SBs (green), SB-dominated S2s (yellow), and SB-dominated LINERs (purple). We also show one standard deviation as a shaded region using the same colours. Each spectrum is also marked with different symbols at 27 μm for clarity of the plot: PG QSOs (orange star), S1s (red square), SBs (green triangle), S2s (yellow square), and LINERs (purple circle). The average spectra are scaled to the flux at 15 μm.

Current usage metrics show cumulative count of Article Views (full-text article views including HTML views, PDF and ePub downloads, according to the available data) and Abstracts Views on Vision4Press platform.
Data correspond to usage on the plateform after 2015. The current usage metrics is available 48-96 hours after online publication and is updated daily on week days.
Initial download of the metrics may take a while.