Fig. 3
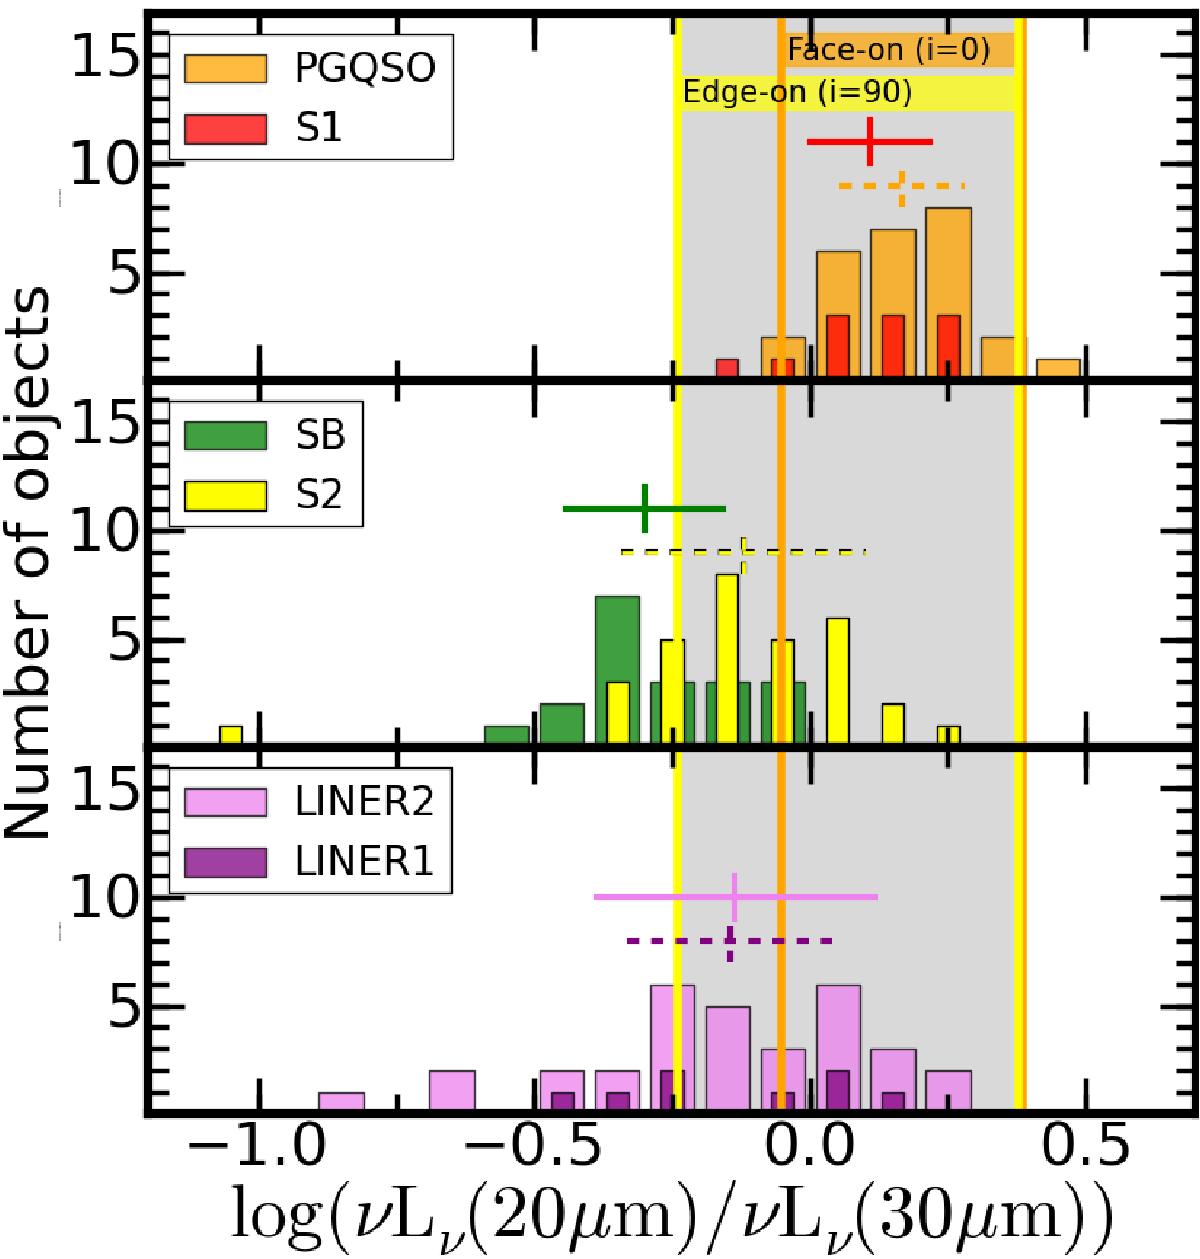
Histograms of log (νLν(20 μm) /νLν(30 μm)) for PG QSO (top panel, broad orange bars), S1 (top panel, narrow red bars), SB (middle panel, broad green bars), S2 (middle panel, narrow yellow bars), LINER1 (bottom panel, narrow purple bars), and LINER2 (bottom panel, broad pink bars). The mean values and one standard deviation over the mean for each class of objects are shown with large crosses (with the same colour code as the histogram), continuous lines for PG QSO, SB, and LINER2, and dashed lines for S1, S2, and LINER1. The grey area of the plot shows the range of values expected for AGN according to the models given by Nenkova et al. (2008). The orange and yellow vertical lines show the same ranges but for inclination angles of i = 0° and i = 90°, assuming that these values are representative of face-on and an edge-on AGN (see text).
Current usage metrics show cumulative count of Article Views (full-text article views including HTML views, PDF and ePub downloads, according to the available data) and Abstracts Views on Vision4Press platform.
Data correspond to usage on the plateform after 2015. The current usage metrics is available 48-96 hours after online publication and is updated daily on week days.
Initial download of the metrics may take a while.