Fig. 2
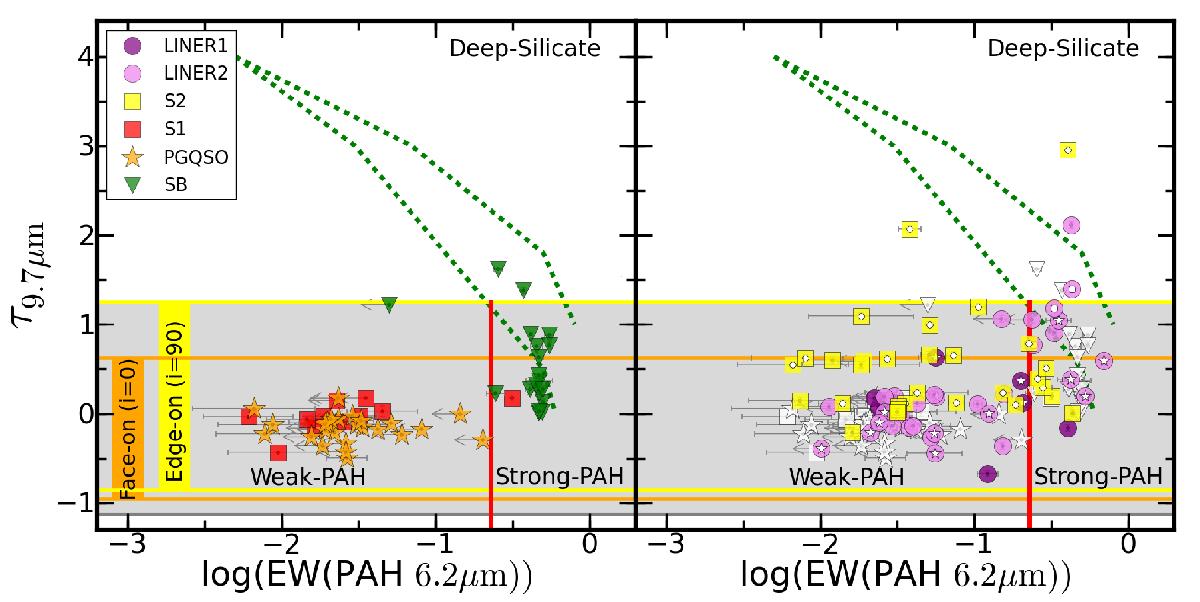
Silicate apparent depth at 9.7 μm, τ9.7, versus the EW of PAH at 6.2 μm, EW(PAH 6.2 μm), for PG QSOs, S1s, and SBs (left) and for LINERs and S2s, (right). LINER1s, LINER2s, S1s, S2s, PG-QSOs, and SBs are shown with purple and pink circles, red and yellow squares, orange stars, and green upside-down triangles, respectively. White circles and white stars denote known Compton-thick sources and Compton-thick candidates, respectively. The error bars in τ9.7 are always within the size of the symbol. In the right panel we also include PG QSOs, S1s, and SBs with white symbols for comparison purposes. Green-dotted lines indicate the diagonal branch found by Spoon et al. (2007) for ULIRGs and SBs. The shadowed (grey) area shows the range of values for τ9.7 that could be explained with clumpy models (Nenkova et al. 2008). We also use orange and yellow lines to show the expected range of values for τ9.7 in face-on AGN (assuming i = 0°) and in edge-on AGN (assuming i = 90°) using the models described by Nenkova et al. (2008) (see text). The short red vertical line shows EW(PAH6.2 μm) = 0.228 μm, which divides into weak and strong PAHs.
Current usage metrics show cumulative count of Article Views (full-text article views including HTML views, PDF and ePub downloads, according to the available data) and Abstracts Views on Vision4Press platform.
Data correspond to usage on the plateform after 2015. The current usage metrics is available 48-96 hours after online publication and is updated daily on week days.
Initial download of the metrics may take a while.