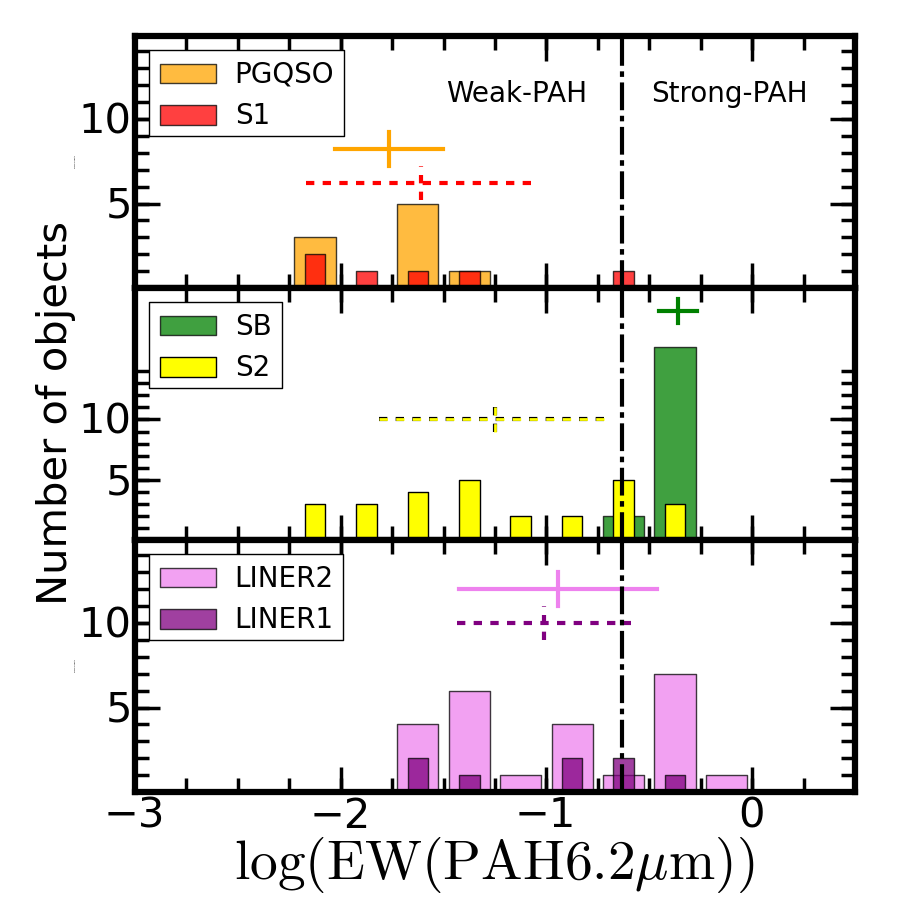
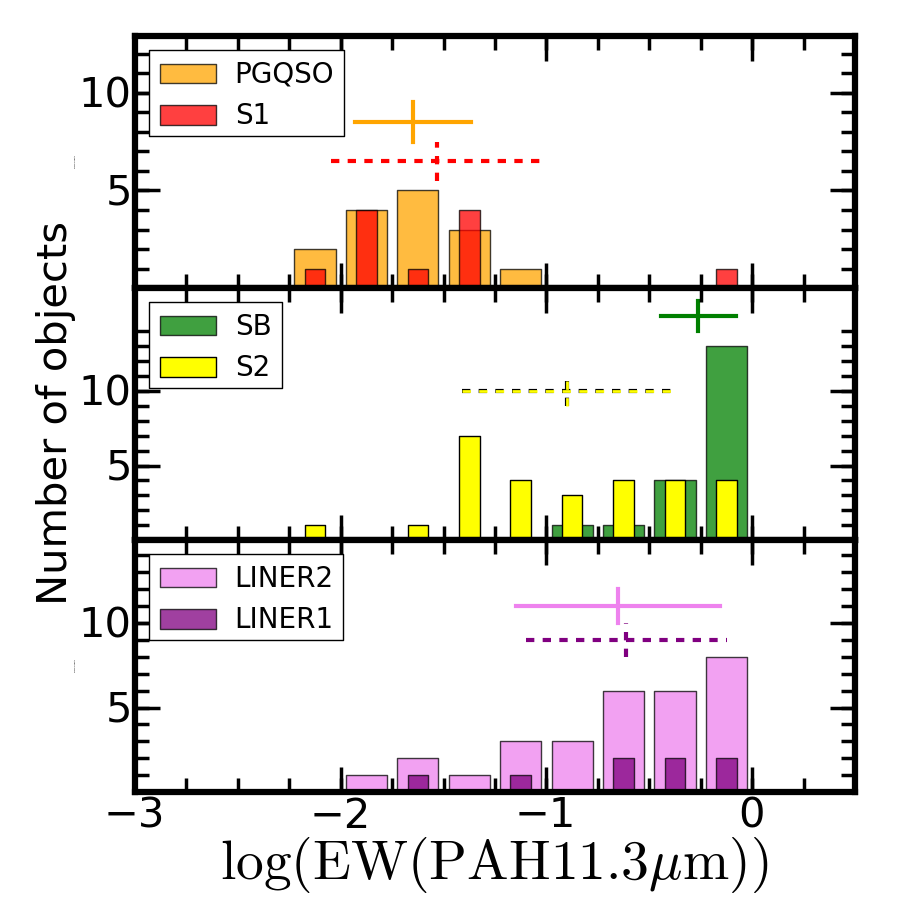
Fig. 1
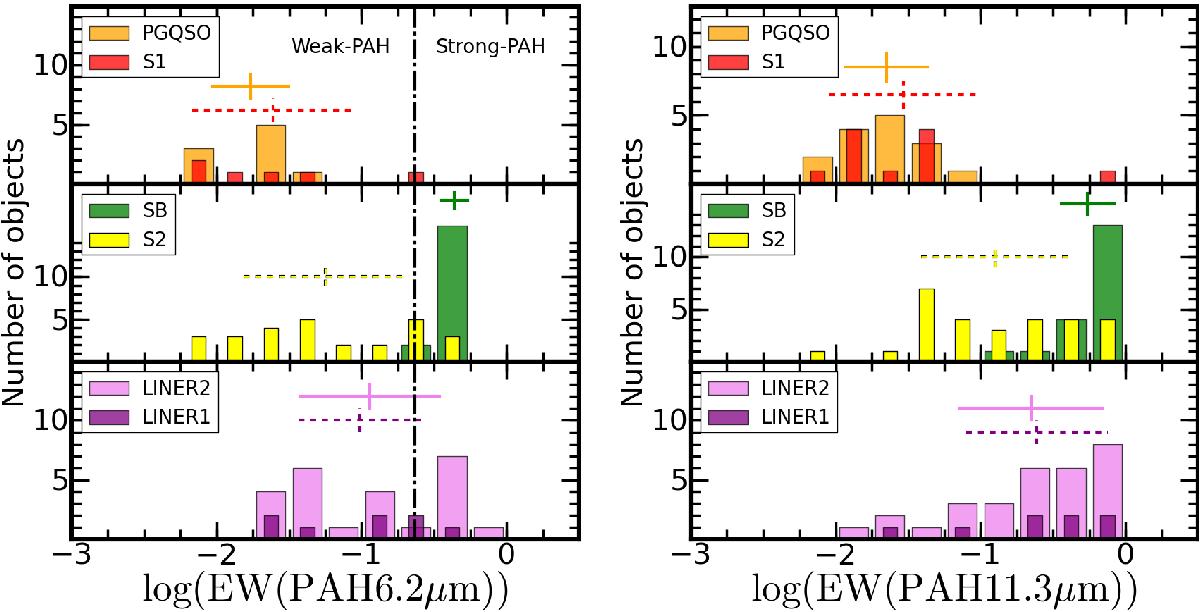
Histograms of the EW of the PAH at 6.2 μm (left) and at 11.3 μm (right) for PG QSO (top panel, broad orange bars), S1 (top panel, narrow red bars), SB (middle panel, broad green bars), S2 (middle panel, narrow yellow bars), LINER1 (bottom panel, narrow purple bars), and LINER2 (bottom panel, broad pink bars). The median values and 25th−75th percentile range for each class of object are shown with large crosses (with the same colour code as the histogram) with continuous lines for PG QSO, SB, and LINER2 and with dashed lines for S1, S2, and LINER1. The vertical dot-dashed line shows the limit chosen to divide the sample into strong- and weak-PAHs (see text).
Current usage metrics show cumulative count of Article Views (full-text article views including HTML views, PDF and ePub downloads, according to the available data) and Abstracts Views on Vision4Press platform.
Data correspond to usage on the plateform after 2015. The current usage metrics is available 48-96 hours after online publication and is updated daily on week days.
Initial download of the metrics may take a while.