Fig. 6
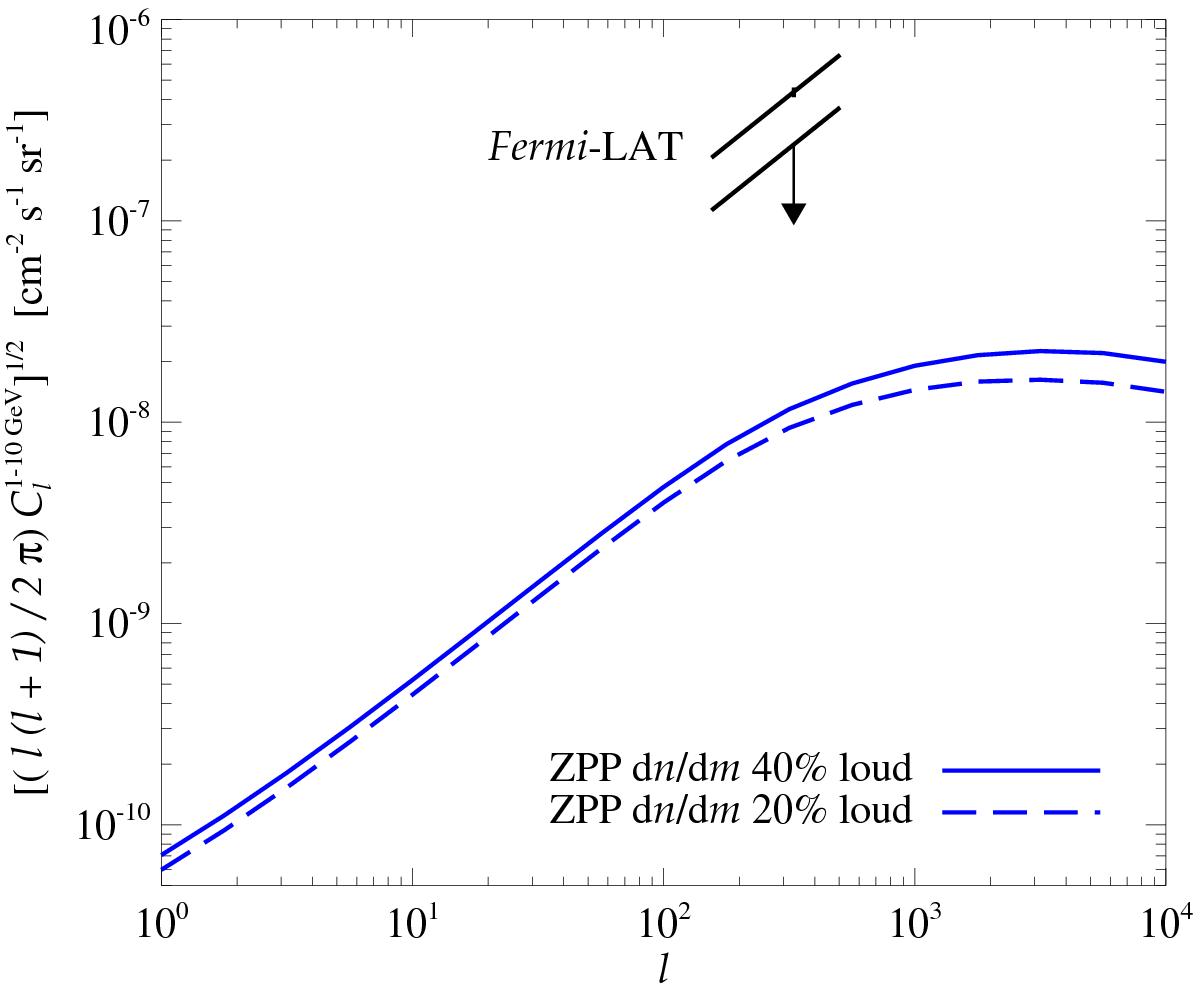
Gamma-ray angular power spectrum for emission resulting from proton-proton interactions in galaxy clusters in the energy range 1−10 GeV. We show the result for the semi-analytical model of Sect. 4 for 20% and 40% loud clusters. We plot the EGB anisotropy measured by Fermi (Fermi LAT Collaboration 2012) for comparison, which is explained by unresolved blazars, and the upper limits obtained once the blazar component is subtracted (Cuoco et al. 2012). We plot the square root of ℓ(ℓ + 1)Cℓ/ 2π, which implies that the shown quantity is directly proportional to an increase in intensity.
Current usage metrics show cumulative count of Article Views (full-text article views including HTML views, PDF and ePub downloads, according to the available data) and Abstracts Views on Vision4Press platform.
Data correspond to usage on the plateform after 2015. The current usage metrics is available 48-96 hours after online publication and is updated daily on week days.
Initial download of the metrics may take a while.