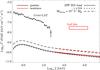
Fig. 5
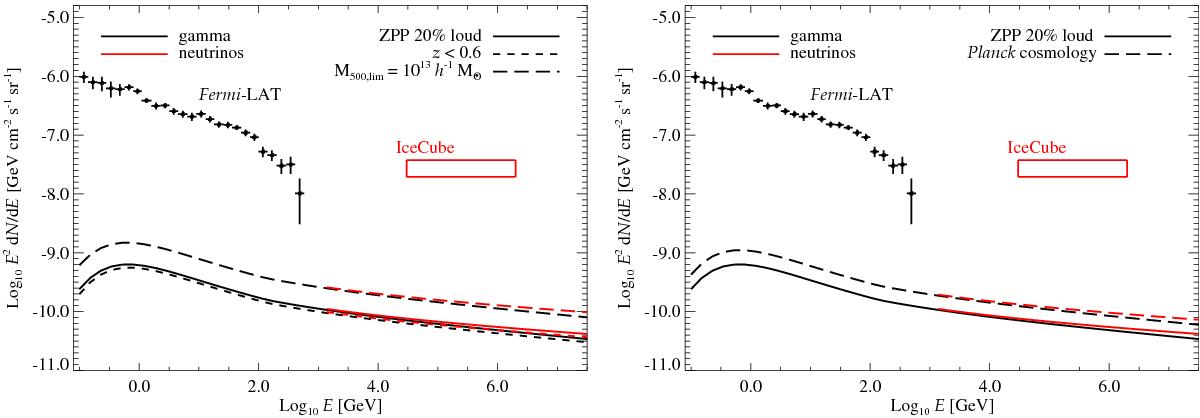
Same as in the left panel of Fig. 4 for 20% loud clusters. The left panel shows the comparison with the previous model with one obtained adopting z2 = 0.6, and one with a lower mass integration limit, of 1013h-1M⊙. The right panel shows the comparison with the model in Fig. 4 and one obtained using the Planck cosmological data.
Current usage metrics show cumulative count of Article Views (full-text article views including HTML views, PDF and ePub downloads, according to the available data) and Abstracts Views on Vision4Press platform.
Data correspond to usage on the plateform after 2015. The current usage metrics is available 48-96 hours after online publication and is updated daily on week days.
Initial download of the metrics may take a while.