Fig. 3
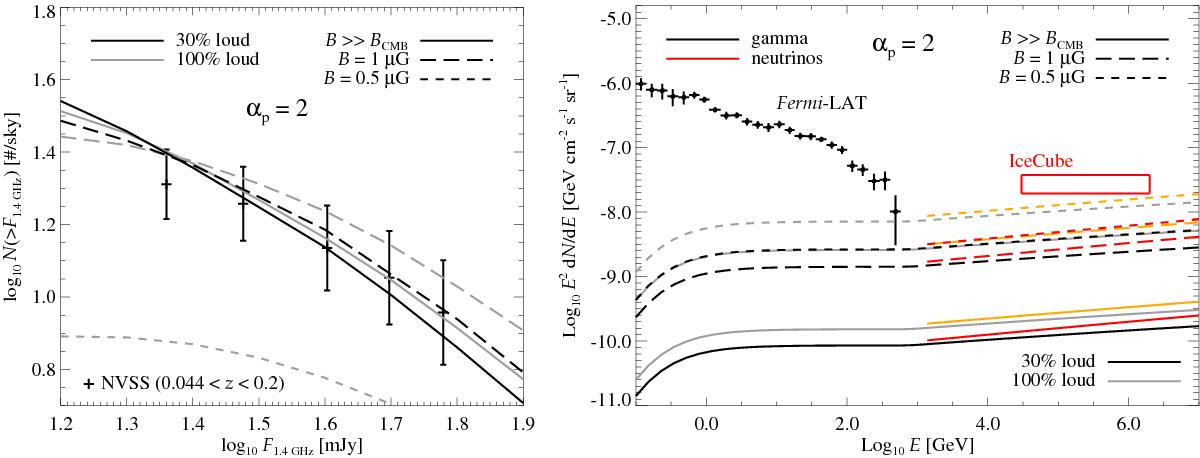
Same as Fig. 3, together with the case of 30% loud clusters for αp = 2. The remaining percentage of 70% quiet clusters has been assumed to have Lγ(100 MeV) one order of magnitude lower than for the loud clusters. The 100% loud case is shown with lighter colours (i.e., in grey and orange).
Current usage metrics show cumulative count of Article Views (full-text article views including HTML views, PDF and ePub downloads, according to the available data) and Abstracts Views on Vision4Press platform.
Data correspond to usage on the plateform after 2015. The current usage metrics is available 48-96 hours after online publication and is updated daily on week days.
Initial download of the metrics may take a while.