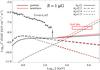
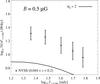
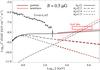
Fig. 2
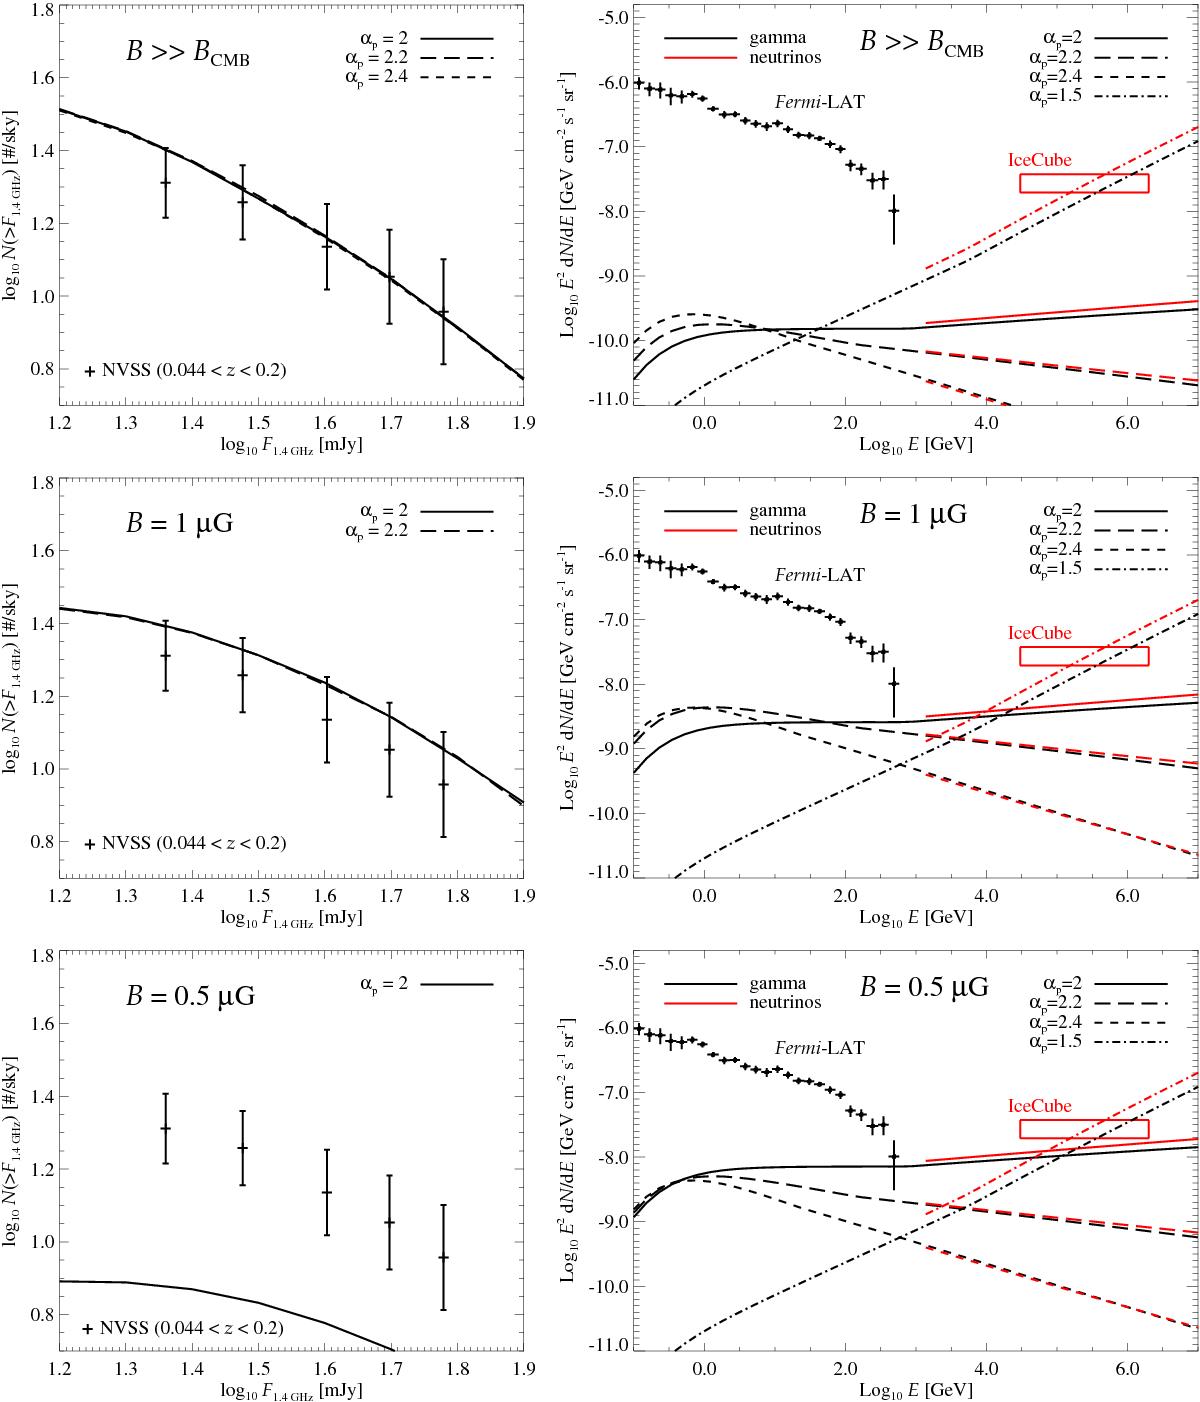
Total gamma-ray and neutrino intensities (right) due to hadronic interactions in galaxy clusters, for 100% loud clusters, and the corresponding radio counts due to synchrotron emission from secondary electrons (left). From top to bottom, we plot the cases with B ≫ BCMB, B = 1μG and 0.5μG, respectively. For comparison, the Fermi (Fermi LAT Collaboration 2015a) and IceCube (Aartsen et al. 2014a) data are shown in the panels on the right. The neutrino intensity is meant for all flavours. All the plotted intensities respect NVSS radio counts and the gamma-ray upper limits on individual clusters. For B = 1μG and αp = 2.4, B = 0.5μG and αp = 2.2,2.4, and for αp = 1.5, the radio counts respecting the gamma-ray and neutrino limits, respectively, are below the y-scale range adopted for the panels on the left.
Current usage metrics show cumulative count of Article Views (full-text article views including HTML views, PDF and ePub downloads, according to the available data) and Abstracts Views on Vision4Press platform.
Data correspond to usage on the plateform after 2015. The current usage metrics is available 48-96 hours after online publication and is updated daily on week days.
Initial download of the metrics may take a while.