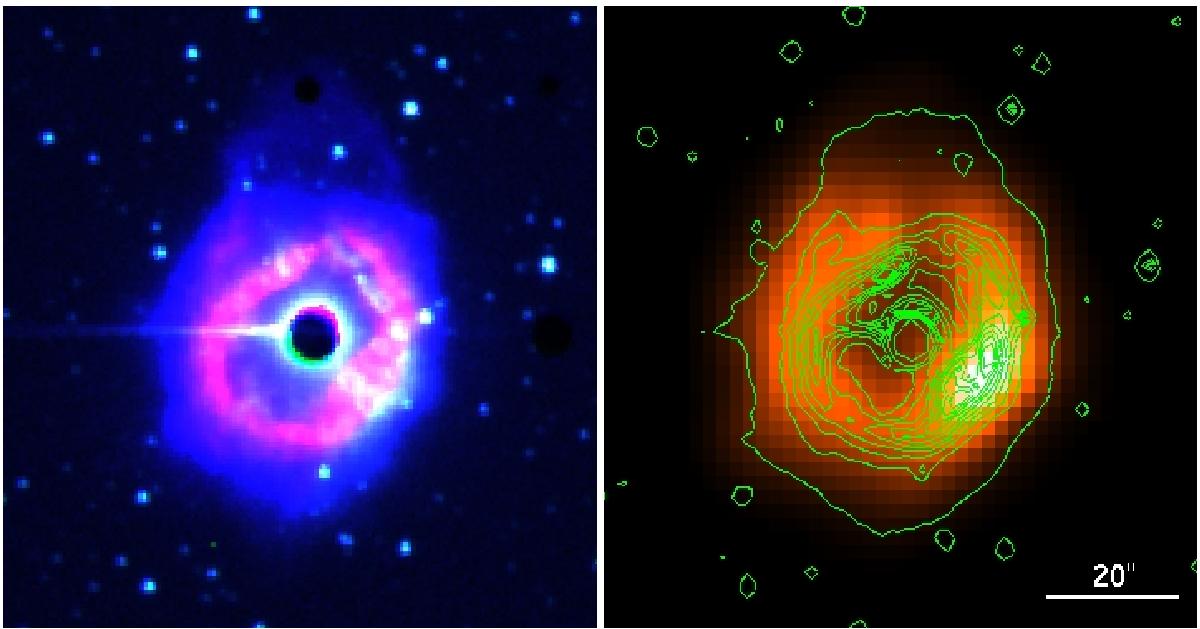
Fig. 2

Left: view of the nebula in the optical. The bright Hα+[ N ii ] ring nebula is illustrated in red (also shown in Fig. 1 at the same scale) while the fainter Hα+[ N ii ] emission is shown in blue, differently scaled in surface brightness, revealing the northern extension (Weis 2008). The continuum image that outlines the dust scattered nebula is presented in green. Right: contour image of the optical emission from the nebula (green lines) superposed on the infrared image of the nebula at 70 μm (also shown in Fig. 1 at the same scale). The size of each image is 1.5′× 1.5′. North is up and east is to the left.
Current usage metrics show cumulative count of Article Views (full-text article views including HTML views, PDF and ePub downloads, according to the available data) and Abstracts Views on Vision4Press platform.
Data correspond to usage on the plateform after 2015. The current usage metrics is available 48-96 hours after online publication and is updated daily on week days.
Initial download of the metrics may take a while.


