Free Access
Fig. 9
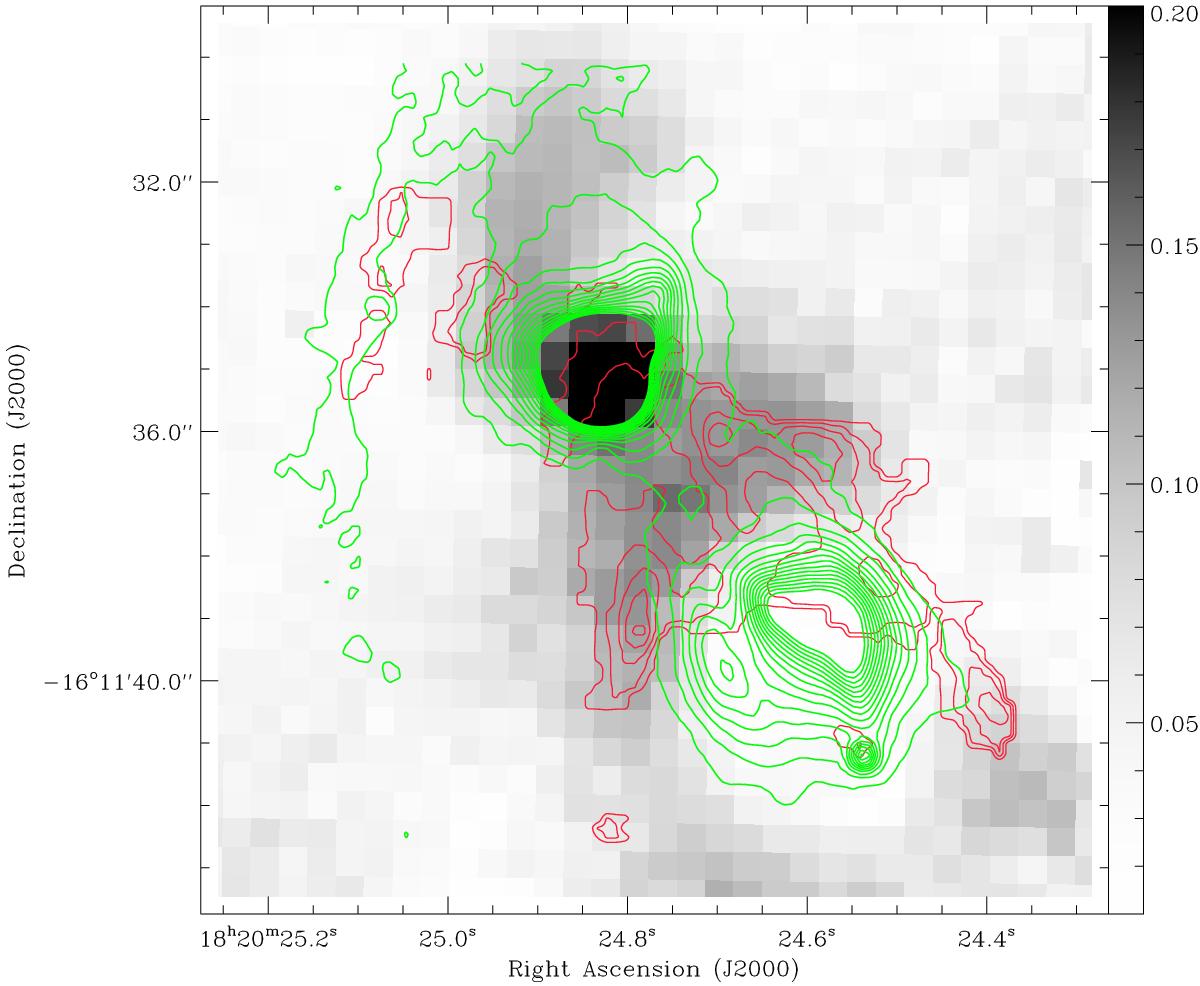
H2 1−0 S(1) line flux (red contours) overlaid on the IRSF/K polarization degree image (gray scale; CZ+12). H2 1−0 S(1) contour levels start from 2 × 10-15 erg cm-2 s-1 arcsec-2 with four intervals, each of 2 × 10-15 erg cm-2 s-1 arcsec-2. Green contours correspond to the VISIR 11.85 μm emission.
Current usage metrics show cumulative count of Article Views (full-text article views including HTML views, PDF and ePub downloads, according to the available data) and Abstracts Views on Vision4Press platform.
Data correspond to usage on the plateform after 2015. The current usage metrics is available 48-96 hours after online publication and is updated daily on week days.
Initial download of the metrics may take a while.