Fig. 8
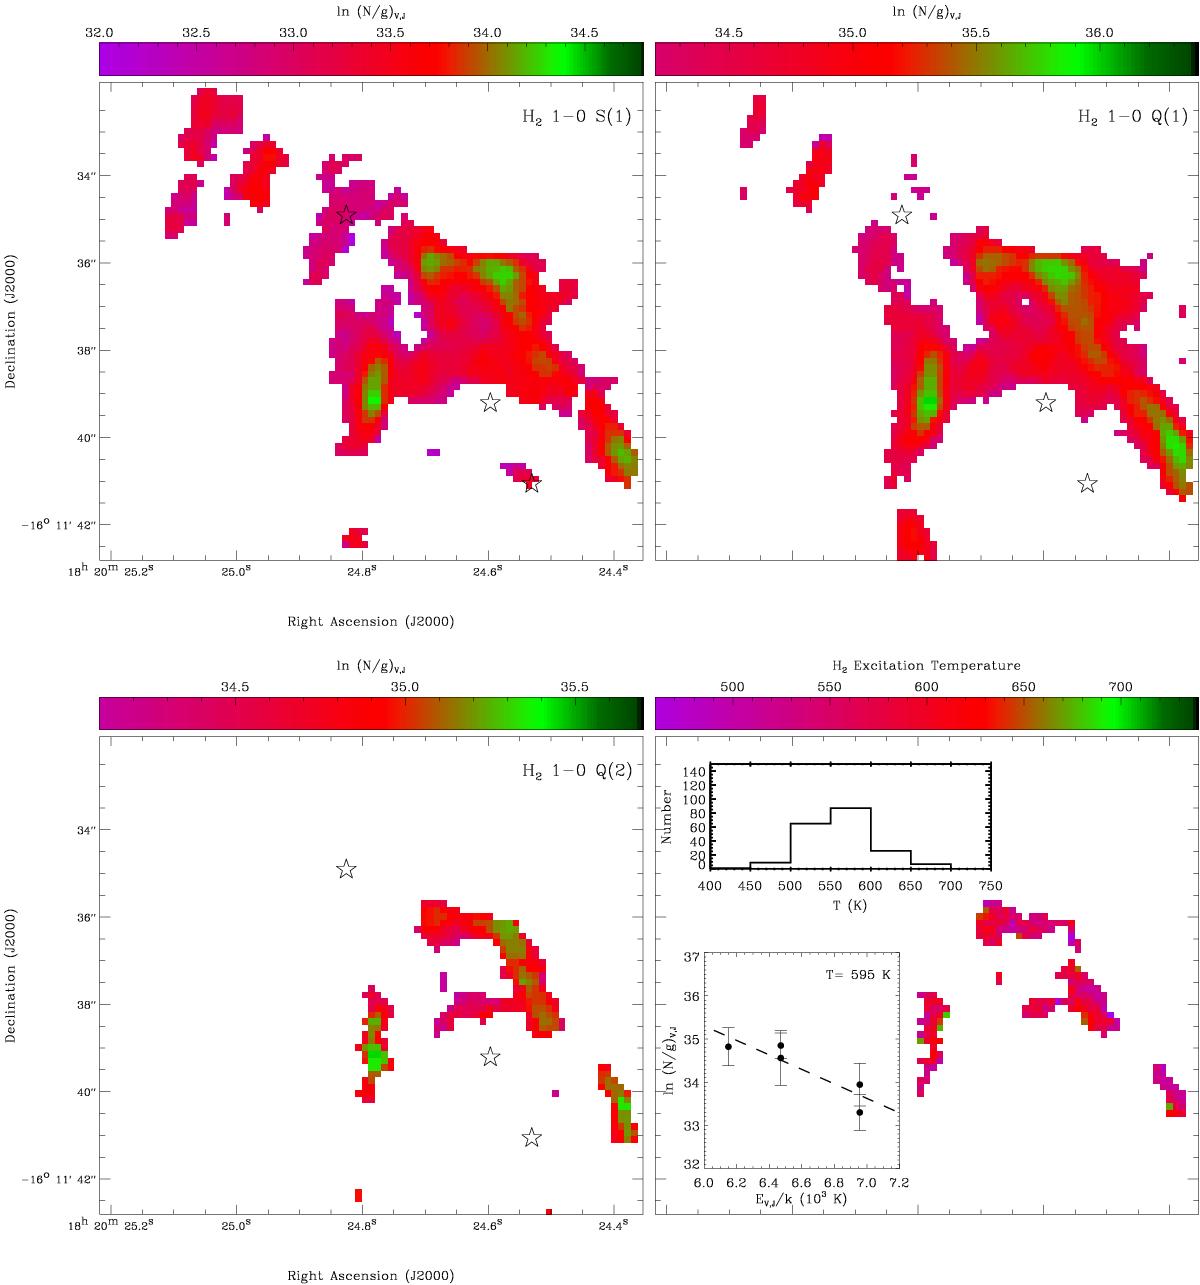
Column densities of H2 1−0 S(1), 1−0 Q(1) and 1−0 Q(2) (quadrants I to III) as well as the H2 excitation temperature map (quadrant IV). In quadrants I to III, IRS5A,C and UC1’s positions are marked with asterisks. In quadrant IV, the ro-vibrational diagram based on the H2 lines (H2 1−0 S(1), 1−0 S(0), 1−0 Q(1), 1−0 Q(2), and 1−0 Q(3)) averaged over all collected pixels is plotted, as well as the histogram density of H2 excitation temperature.
Current usage metrics show cumulative count of Article Views (full-text article views including HTML views, PDF and ePub downloads, according to the available data) and Abstracts Views on Vision4Press platform.
Data correspond to usage on the plateform after 2015. The current usage metrics is available 48-96 hours after online publication and is updated daily on week days.
Initial download of the metrics may take a while.