Fig. 5
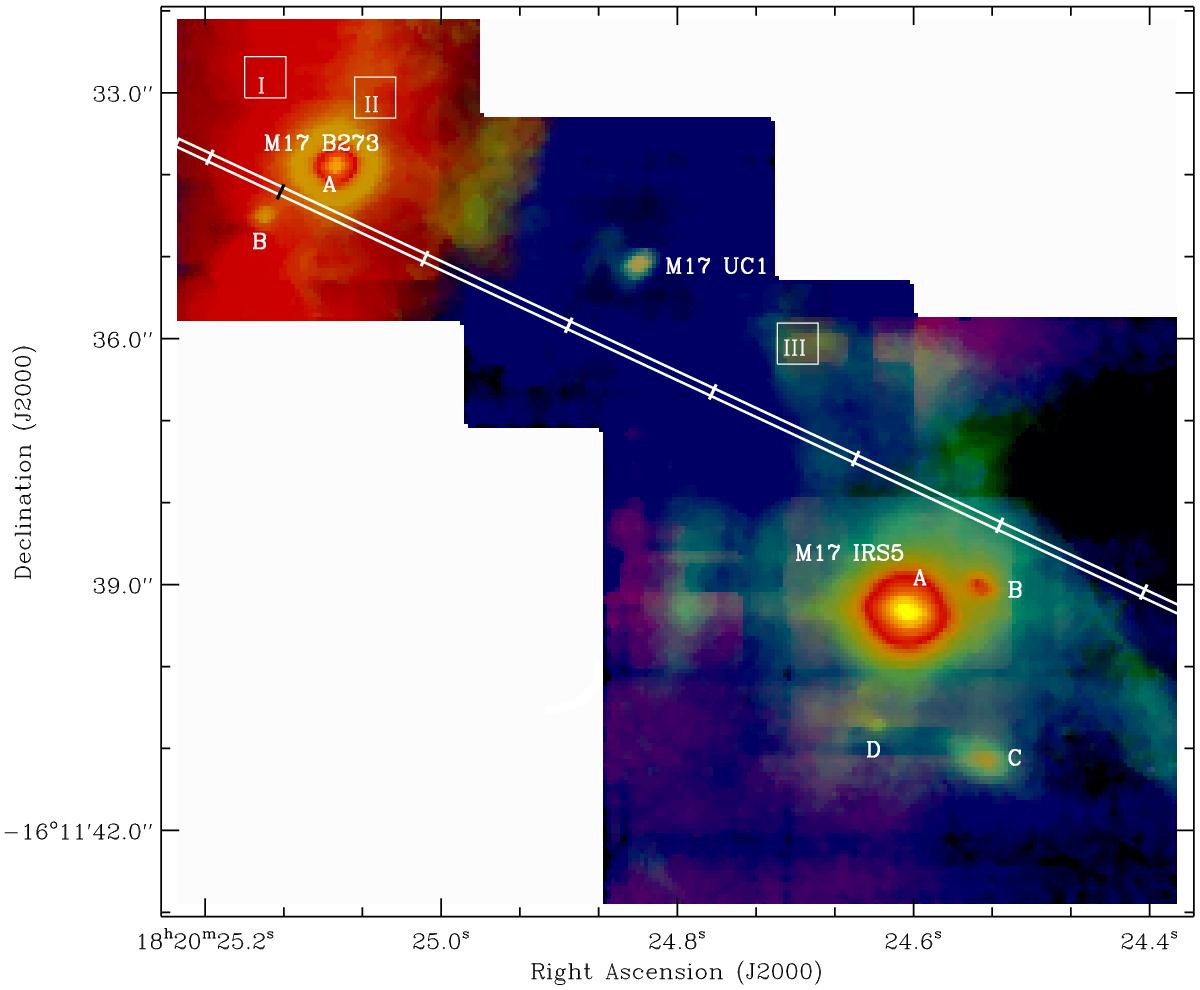
Three-color image created from the emission (line+continuum) of three near-IR lines (red: Brγ2.167 μm, green: H21−0 S(1) 2.122 μm, blue: He i 2.059 μm). The three squares (I, II, and III) mark selected positions representing H ii region, ionization front, and PDR. A strip line with tick marks is also drawn perpendicular to the IF of M 17 SW. Offset at each tick mark is − 1, 0, + 2, + 4, + 6, + 8, + 10, + 12 in arcsec from northeast to southwest, respectively.
Current usage metrics show cumulative count of Article Views (full-text article views including HTML views, PDF and ePub downloads, according to the available data) and Abstracts Views on Vision4Press platform.
Data correspond to usage on the plateform after 2015. The current usage metrics is available 48-96 hours after online publication and is updated daily on week days.
Initial download of the metrics may take a while.