Fig. 14
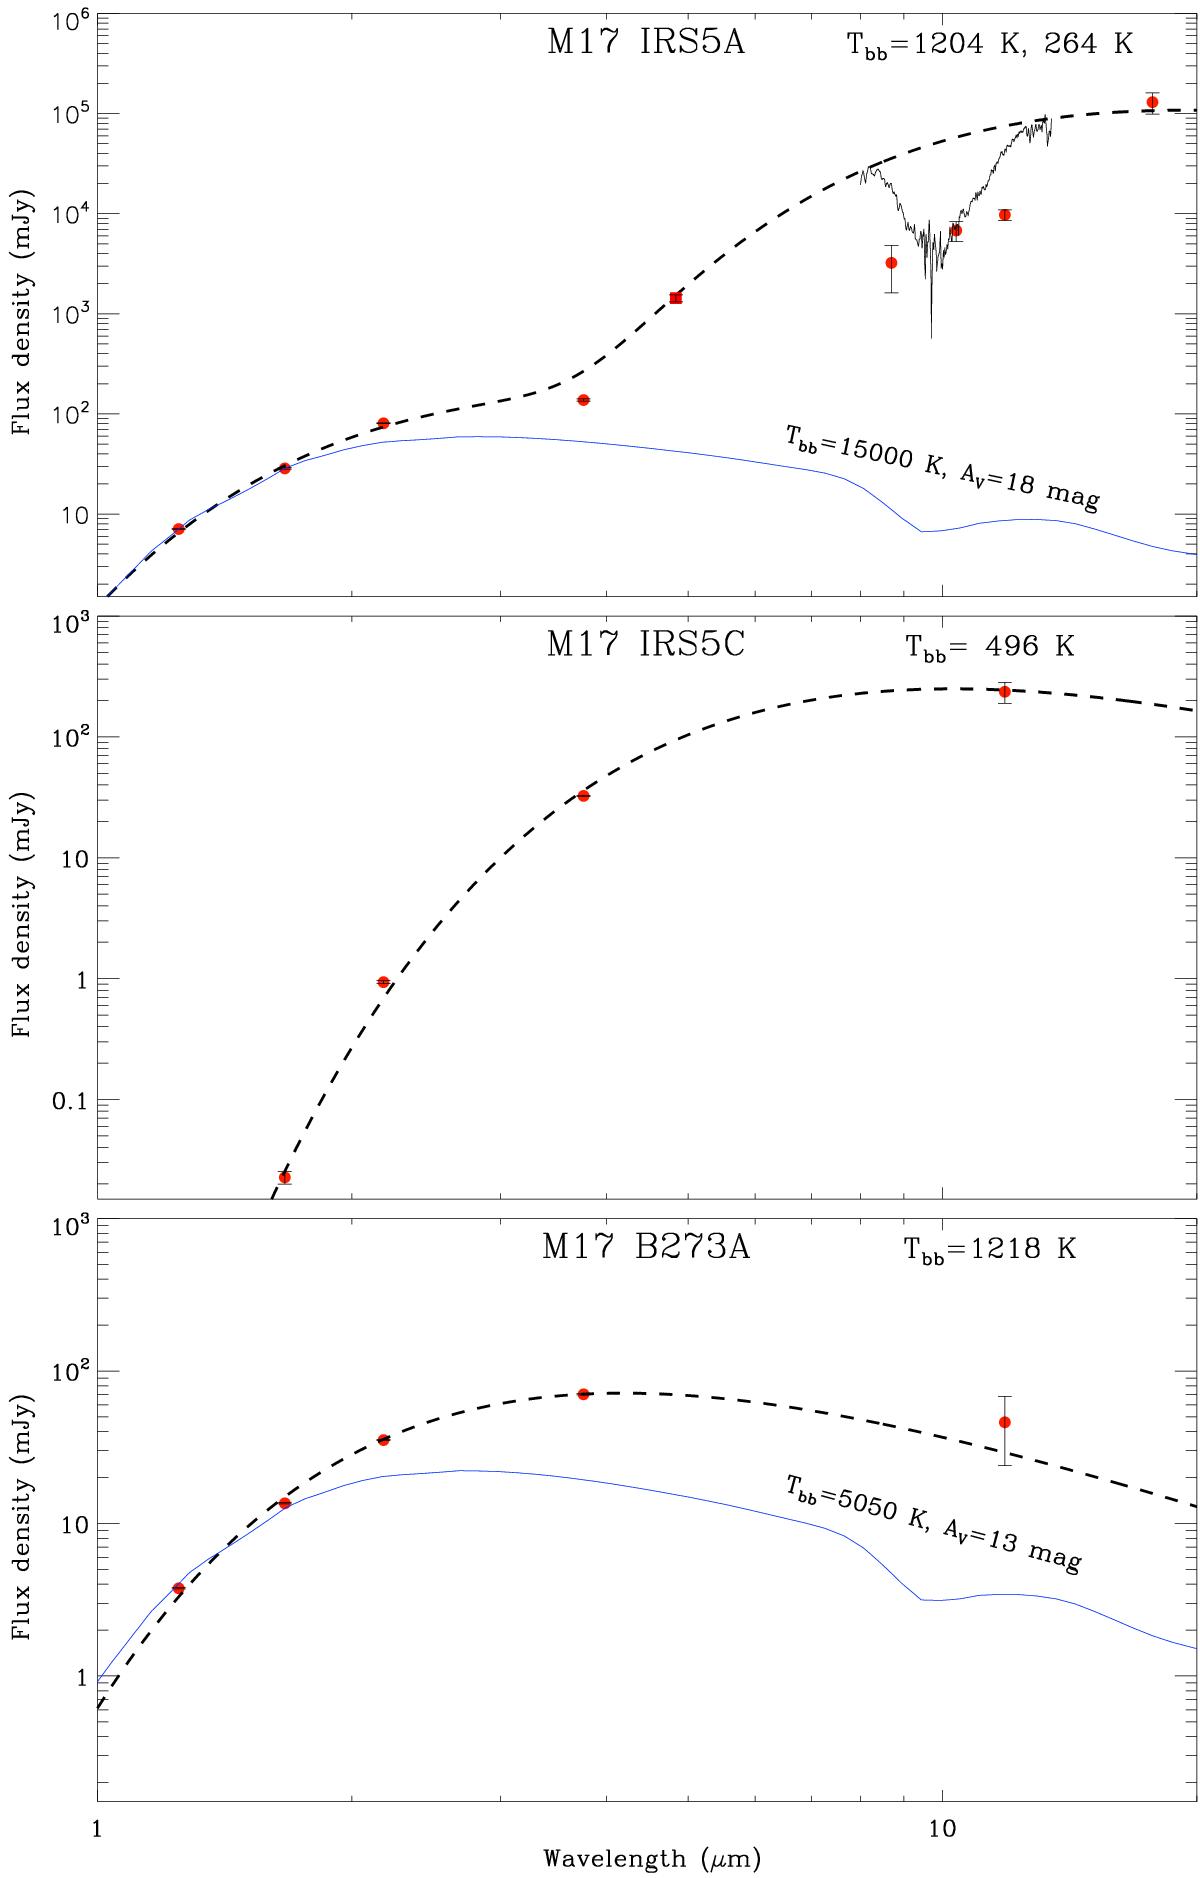
SEDs constructed based on the flux measurements summarized in Tables 2 and 3 (filled circles), and the M-band point by ISAAC (filled square; Hoffmeister 2008). For IRS5A, the TIMMI2 spectrum at around 9.7 μm is denoted by the solid curve in the top panel. The temperature of the blackbody (in blue) corresponds to the proper spectral type according to Cox (2000).
Current usage metrics show cumulative count of Article Views (full-text article views including HTML views, PDF and ePub downloads, according to the available data) and Abstracts Views on Vision4Press platform.
Data correspond to usage on the plateform after 2015. The current usage metrics is available 48-96 hours after online publication and is updated daily on week days.
Initial download of the metrics may take a while.