Fig. 4
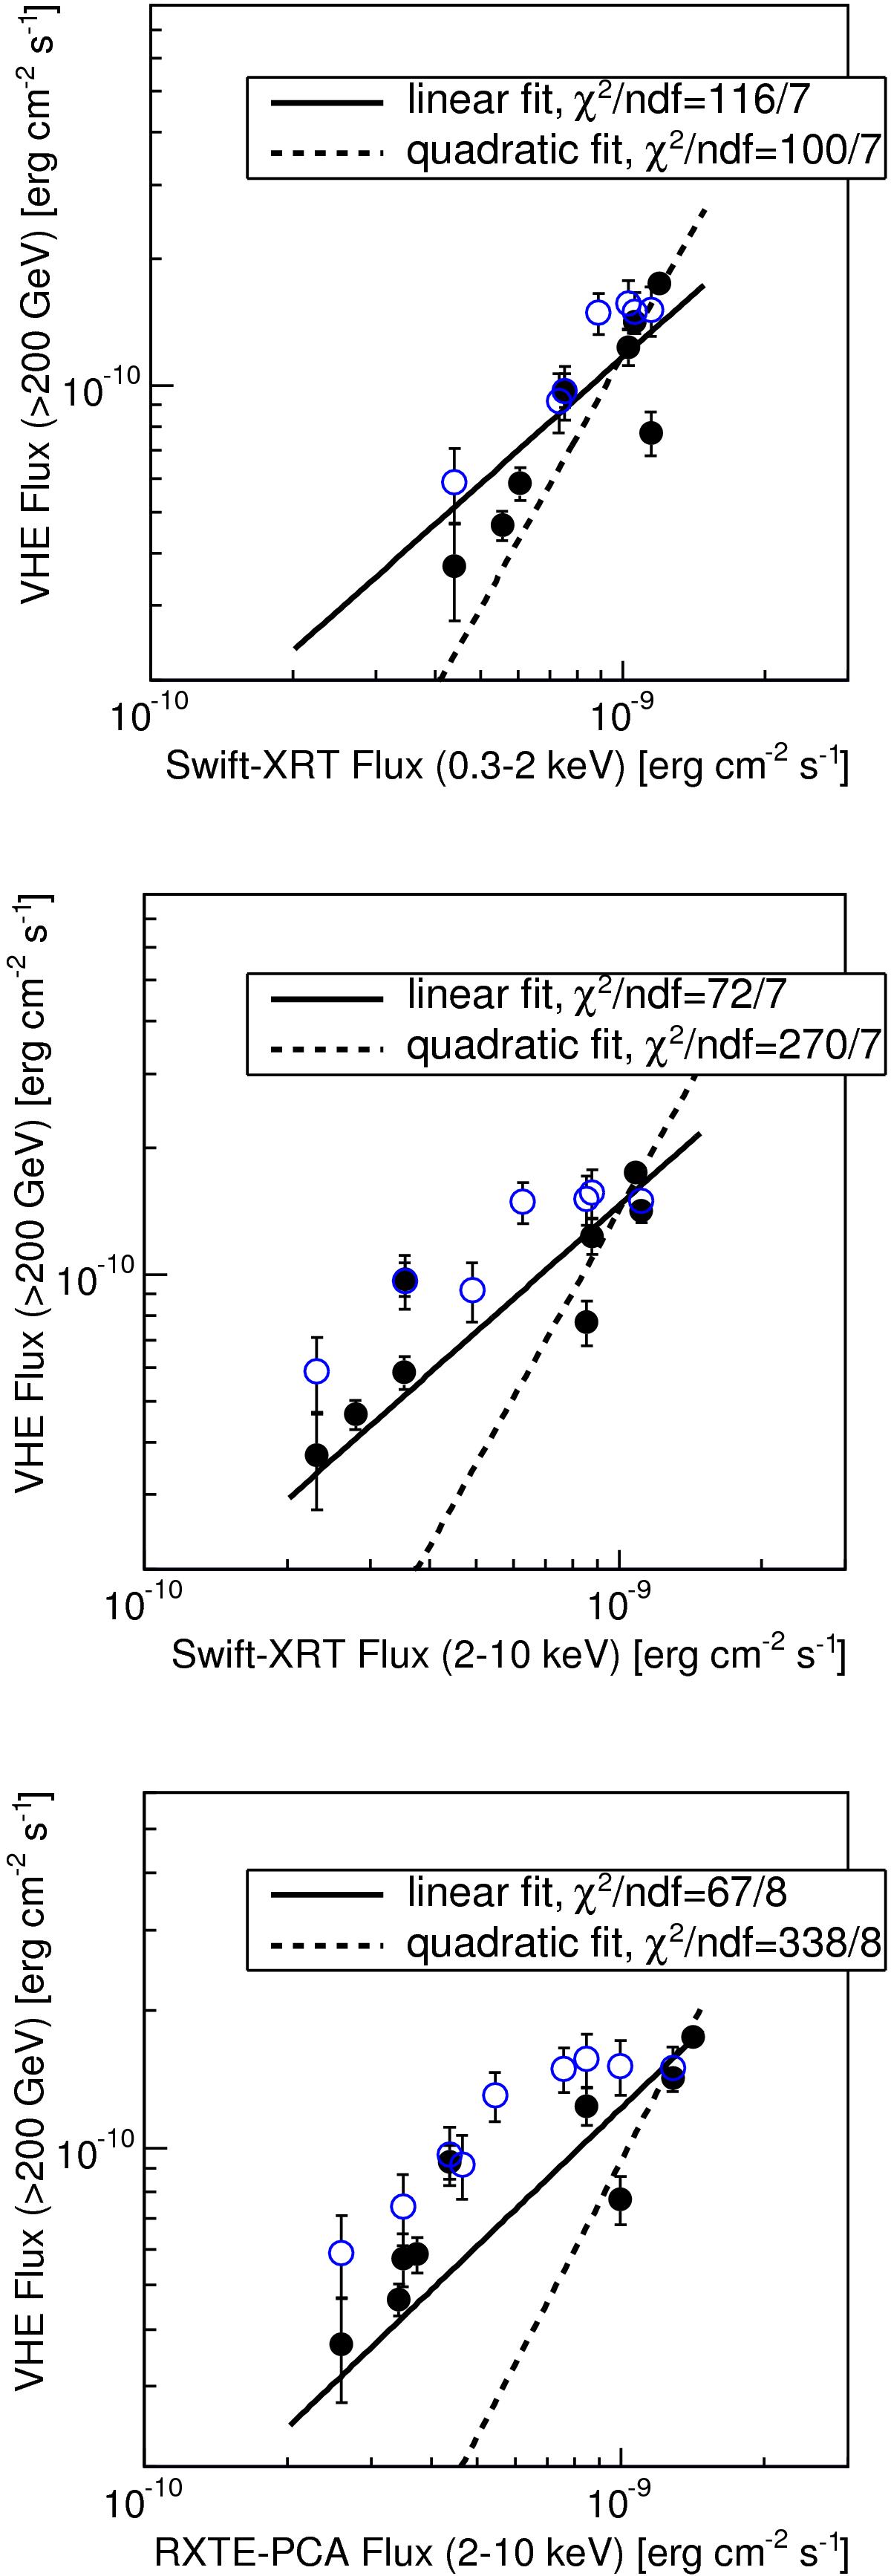
Correlation between VHE γ-ray flux (MAGIC, black solid circles, and VERITAS, blue empty circles) and X-ray fluxes. Top: X-ray flux at the 0.3−2 keV band measured with Swift-XRT. Middle: X-ray flux at the 2−10 keV band measured with Swift-XRT. Bottom: X-ray flux at the 2−10 keV band measured with RXTE-PCA. The lines show the fits with linear and quadratic functions. Only MAGIC data points were used for the fits to ensure VHE-X-ray simultaneity (see Appendix A).
Current usage metrics show cumulative count of Article Views (full-text article views including HTML views, PDF and ePub downloads, according to the available data) and Abstracts Views on Vision4Press platform.
Data correspond to usage on the plateform after 2015. The current usage metrics is available 48-96 hours after online publication and is updated daily on week days.
Initial download of the metrics may take a while.