Free Access
Fig. A.2
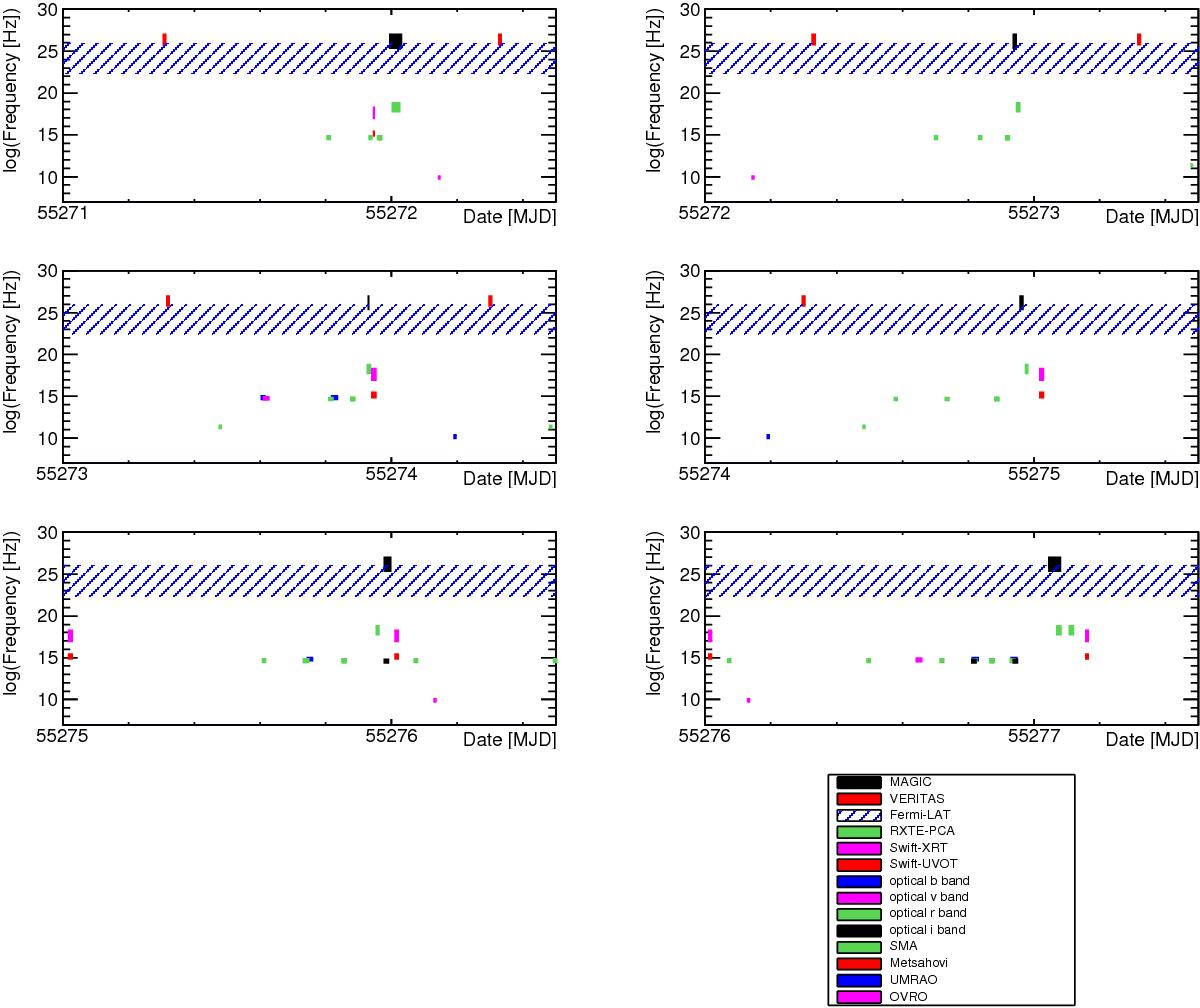
Temporal and energy coverage during the flaring activity from 2010 March 17 (MJD 55 272) to 2010 March 22 (MJD 55 277). See the caption of Fig. A.1 for further details.
Current usage metrics show cumulative count of Article Views (full-text article views including HTML views, PDF and ePub downloads, according to the available data) and Abstracts Views on Vision4Press platform.
Data correspond to usage on the plateform after 2015. The current usage metrics is available 48-96 hours after online publication and is updated daily on week days.
Initial download of the metrics may take a while.