Fig. 3
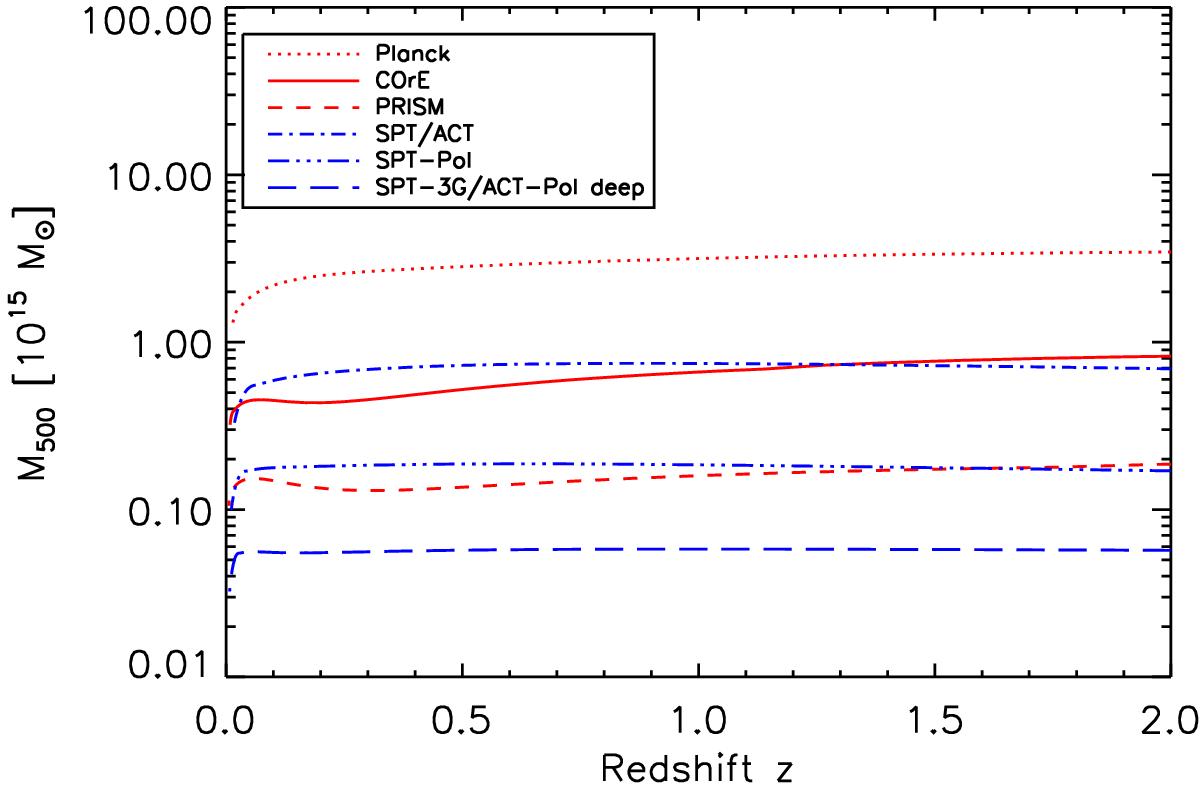
Standard deviation of mass measurements, M500(z), with the matched filter (square root of Eq. (19)) as a function of cluster redshift for the same experimental setups plotted in Fig. 2. This comparison does not take into account the ability of each experiment to eliminate contaminating signals, such as the tSZ, which depends on spectral coverage. In this context, the space-based missions benefit from wider spectral coverage (see text).
Current usage metrics show cumulative count of Article Views (full-text article views including HTML views, PDF and ePub downloads, according to the available data) and Abstracts Views on Vision4Press platform.
Data correspond to usage on the plateform after 2015. The current usage metrics is available 48-96 hours after online publication and is updated daily on week days.
Initial download of the metrics may take a while.