Fig. 2
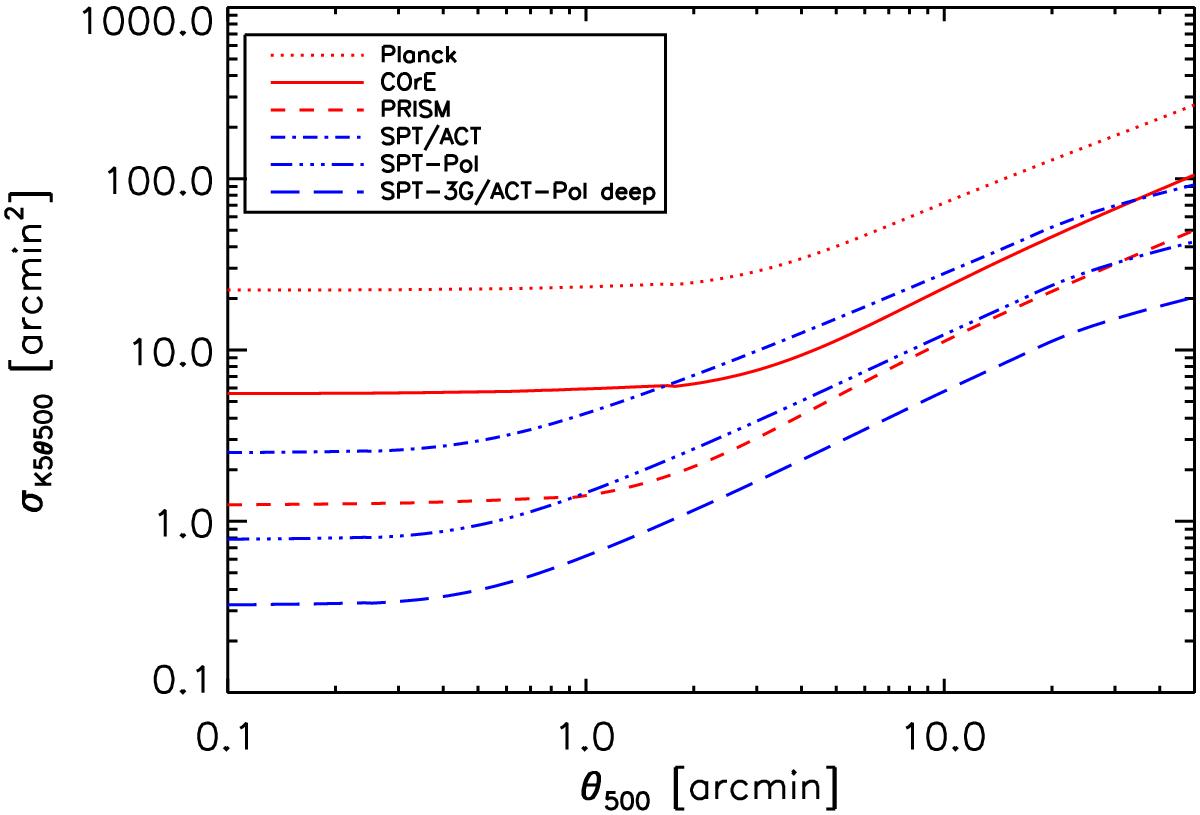
Standard deviation, or filter noise, of the matched filter output (Eq. (16)) versus filter scale θ500 = c500θm for the different experimental setups, as labeled. The red curves give results for the Planck satellite and two future missions proposed to ESA, COrE and PRISM. The first has similar angular resolution to Planck (~ 5 arcmin FWHM), but lower noise, while PRISM has both lower noise and higher resolution at ~ 2.6 arcmin. The blue curves show the noise levels for SPT/ACT, SPT-Pol and SPT-3G/ACT-Pol. All curves assume the filter is perfectly matched to the clusters. The experimental characteristics are summarized in Table 1.
Current usage metrics show cumulative count of Article Views (full-text article views including HTML views, PDF and ePub downloads, according to the available data) and Abstracts Views on Vision4Press platform.
Data correspond to usage on the plateform after 2015. The current usage metrics is available 48-96 hours after online publication and is updated daily on week days.
Initial download of the metrics may take a while.