Fig. 1
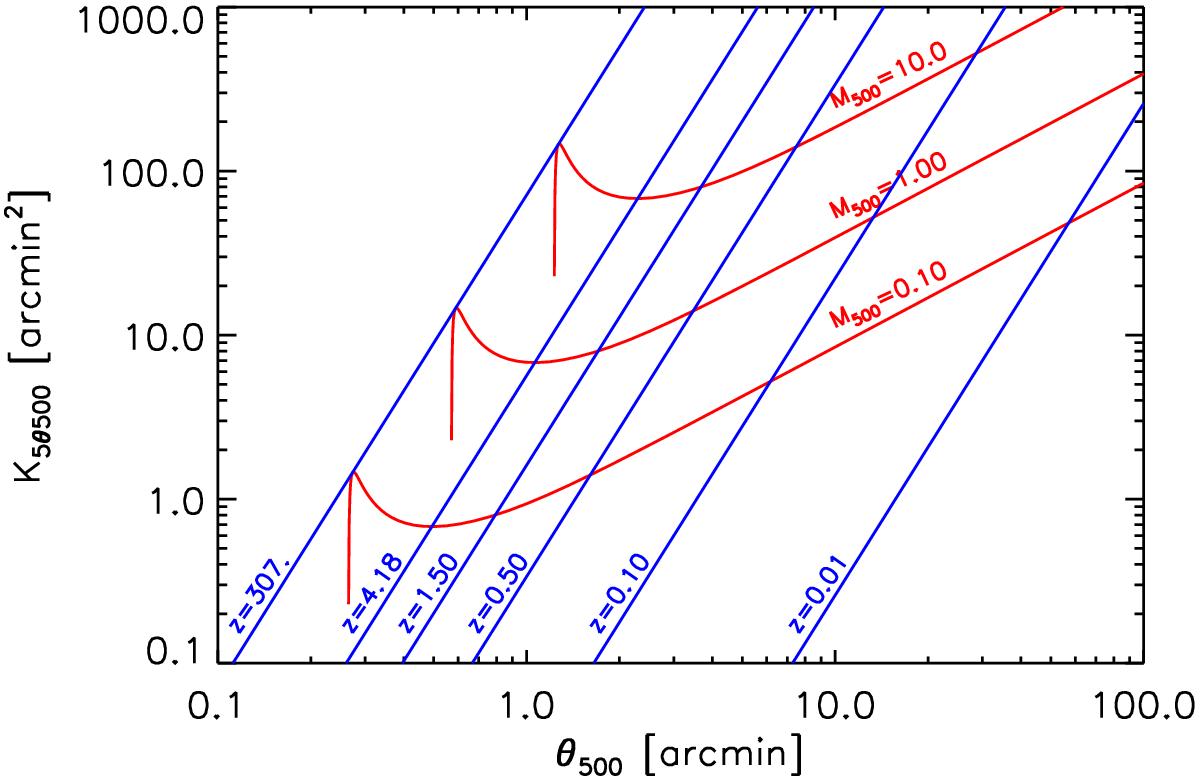
Contours of cluster mass in 1015M⊙ units (red curves) and redshift (blue curves) projected onto the observational plane defined by the filter output K5θ500 and angular scale θ500 = c500θm. A cluster of fixed mass M500 follows a red contour according to Eq. (16) as it moves out in redshift. Each mass contour follows the same pattern, simply displaced in amplitude. This figure shows how each point in the observational plane maps to a point in the cluster plane of (M500,z).
Current usage metrics show cumulative count of Article Views (full-text article views including HTML views, PDF and ePub downloads, according to the available data) and Abstracts Views on Vision4Press platform.
Data correspond to usage on the plateform after 2015. The current usage metrics is available 48-96 hours after online publication and is updated daily on week days.
Initial download of the metrics may take a while.