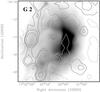
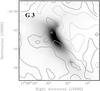
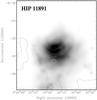
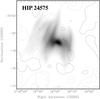
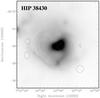
Fig. 3
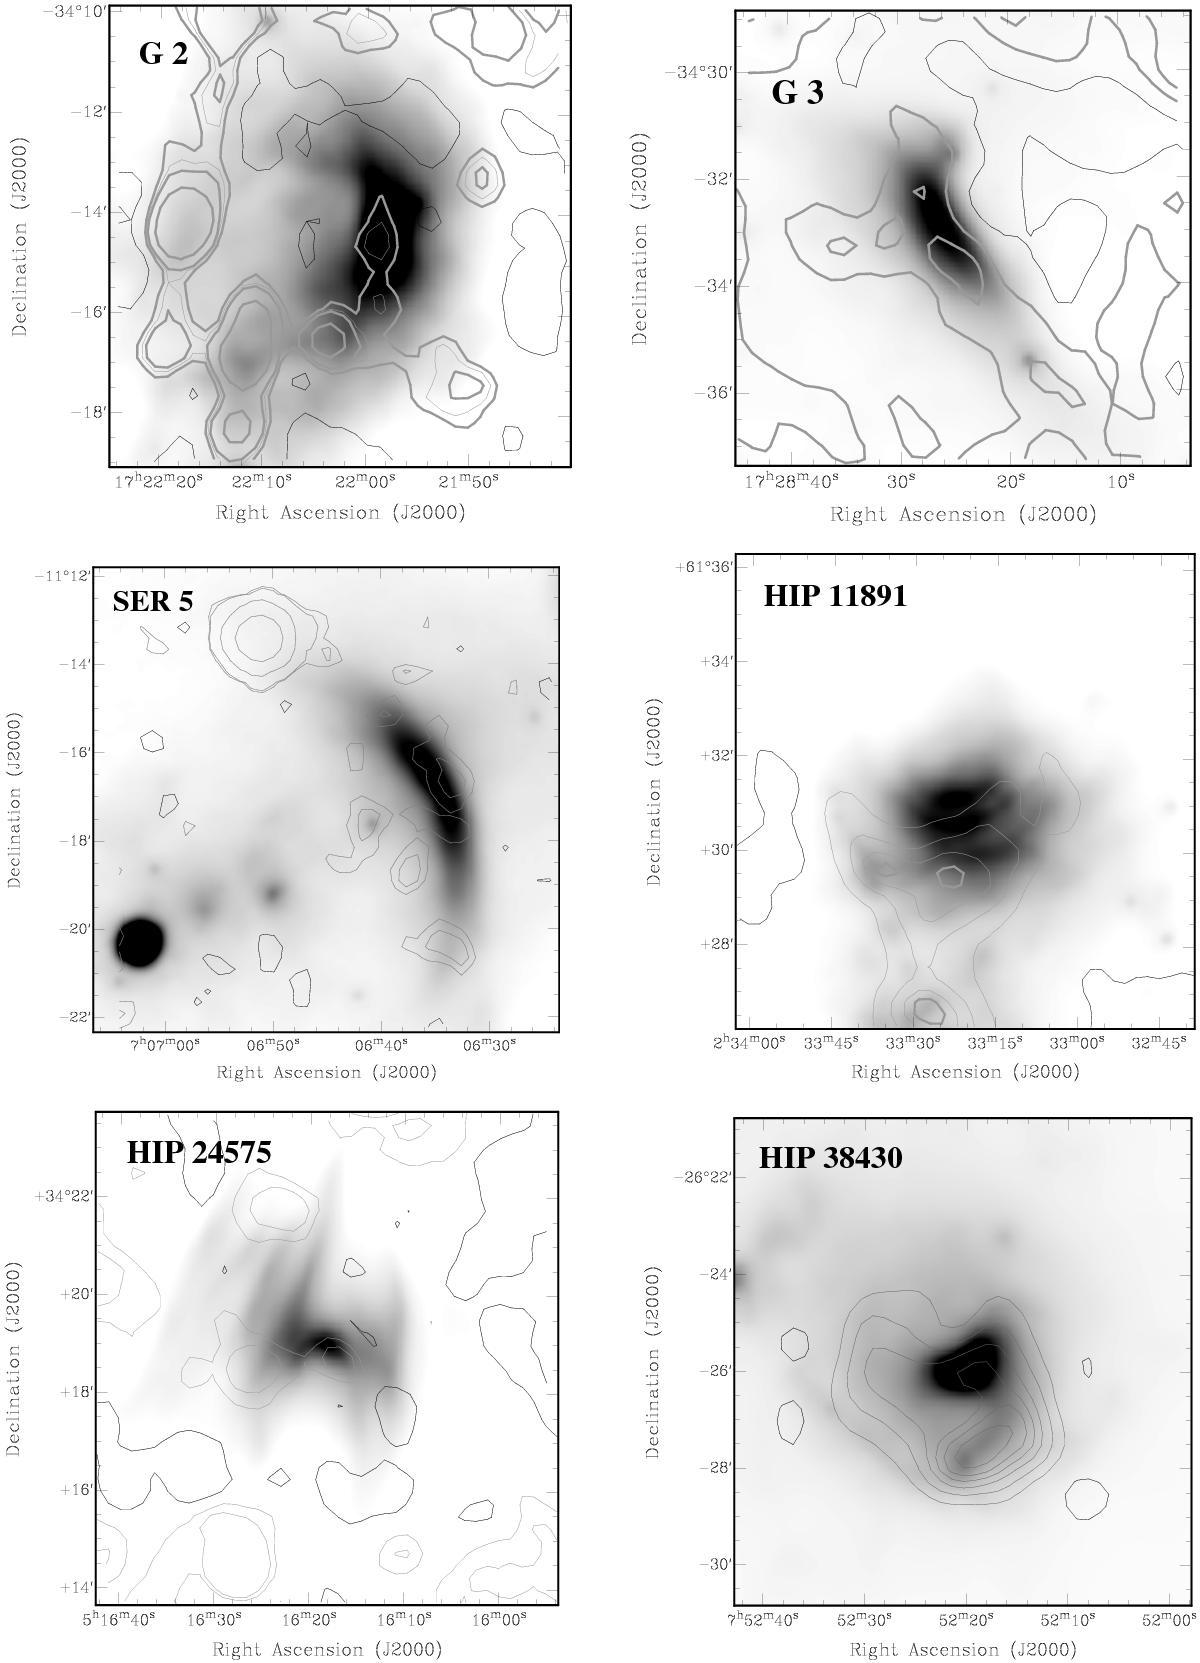
BSCs that show radio emission. Gray scale colors: IR WISE emission (band 4, 22.2 μm). Contours: NVSS 1.4 GHz emission. Positive values in gray, negative in black. Contour levels on each image: top left, −1, 1, 1.5, 2, 5 mJy/b. Top right, −5, 1, 5 mJy/b. Middle left, −1, 1, 1.5, 20, 150 mJy/b. Middle right, −4, 4, 16, 30, 40 mJy/b. Bottom left, −1, 1, 2, 3 mJy/b. Bottom right, −10, 10, 30, 60, 90, 120, 160 mJy/b.
Current usage metrics show cumulative count of Article Views (full-text article views including HTML views, PDF and ePub downloads, according to the available data) and Abstracts Views on Vision4Press platform.
Data correspond to usage on the plateform after 2015. The current usage metrics is available 48-96 hours after online publication and is updated daily on week days.
Initial download of the metrics may take a while.