


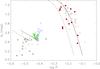
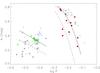
Fig. 17

Bailey diagram of the light curve amplitude A against log P for RRL stars in M 68 in the V (top) and I (bottom) bands. The locations of confirmed RRL stars are marked in red with filled circles (RR0), green filled triangles (RR1), and blue open inverted triangles (RR01). For the RR01 stars, the amplitude is that of the dominant mode, which is the first overtone in all cases here. For the V-band diagram, we also plot the tracks derived by Zorotovic et al. (2010) for evolved stars (solid lines), found by shifting the relations obtained by fitting data for the Oosterhoff type I cluster M 3 (dashed lines) by 0.06 in log P. For the I-band diagram, we plot the rescaling of those relations by Kunder et al. (2013b) for Oosterhoff type I (dashed lines) and type II (solid lines) clusters. On both diagrams we also plot the RRL stars in Oosterhoff type II clusters NGC 5024 (Arellano Ferro et al. 2011) and M 9 (Arellano Ferro et al. 2013a) in light grey. For those, RR0 and RR1 stars are plotted as open diamonds and filled squares, respectively, with RRL stars exhibiting Blazhko modulation plotted as + signs (RR0) and crosses (RR1). One double-mode star is also plotted as an asterisk.
Current usage metrics show cumulative count of Article Views (full-text article views including HTML views, PDF and ePub downloads, according to the available data) and Abstracts Views on Vision4Press platform.
Data correspond to usage on the plateform after 2015. The current usage metrics is available 48-96 hours after online publication and is updated daily on week days.
Initial download of the metrics may take a while.