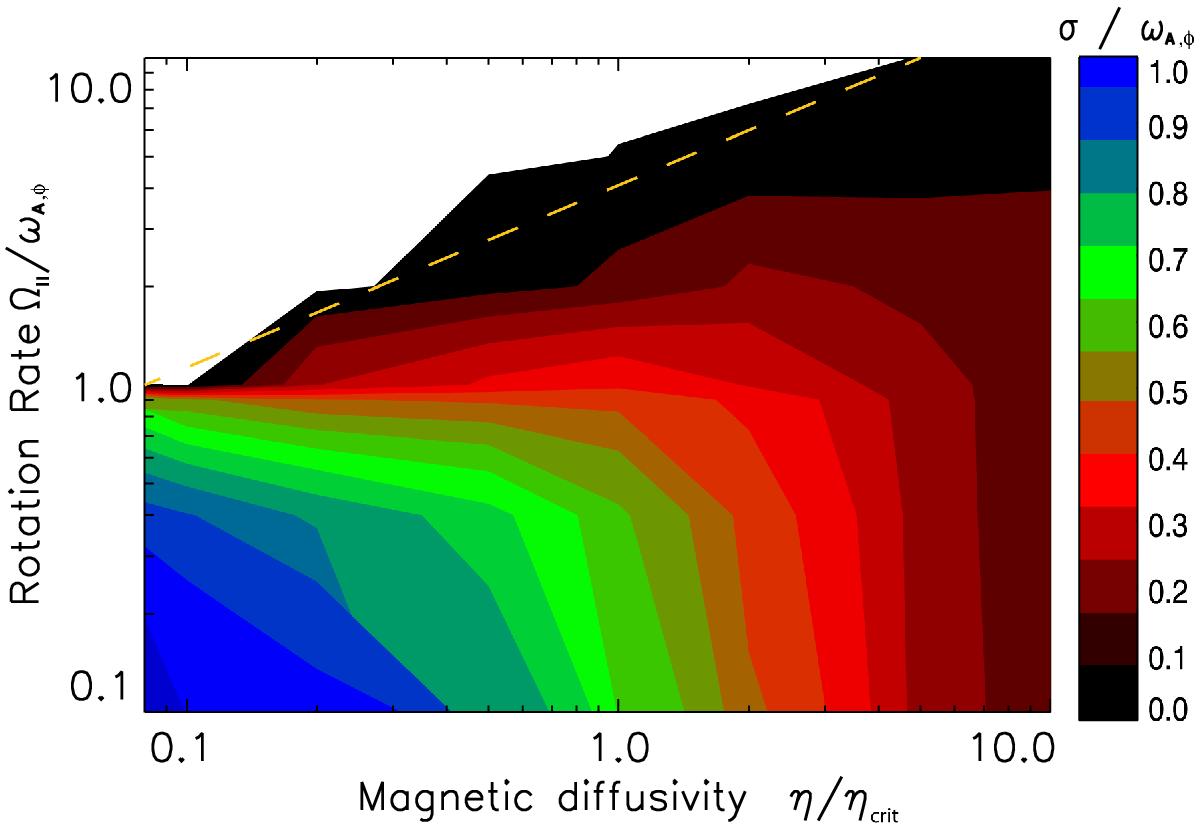
Fig. 9

Contours of mean growth rate plotted as a function of normalized rotation rate nΩ∥ = Ω∥/ωA,φ and the relative magnetic diffusion nη = η/ηcrit. The white region represents stability, for at least 100τA. The color contours correspond to increasing growth rates of the instability, where black corresponds to small and blue to fast growth rates. The yellow dashed line corresponds to the relation nΩ∥ = 2nη + 1 separating the stable and unstable regions.
Current usage metrics show cumulative count of Article Views (full-text article views including HTML views, PDF and ePub downloads, according to the available data) and Abstracts Views on Vision4Press platform.
Data correspond to usage on the plateform after 2015. The current usage metrics is available 48-96 hours after online publication and is updated daily on week days.
Initial download of the metrics may take a while.


