Fig. 5
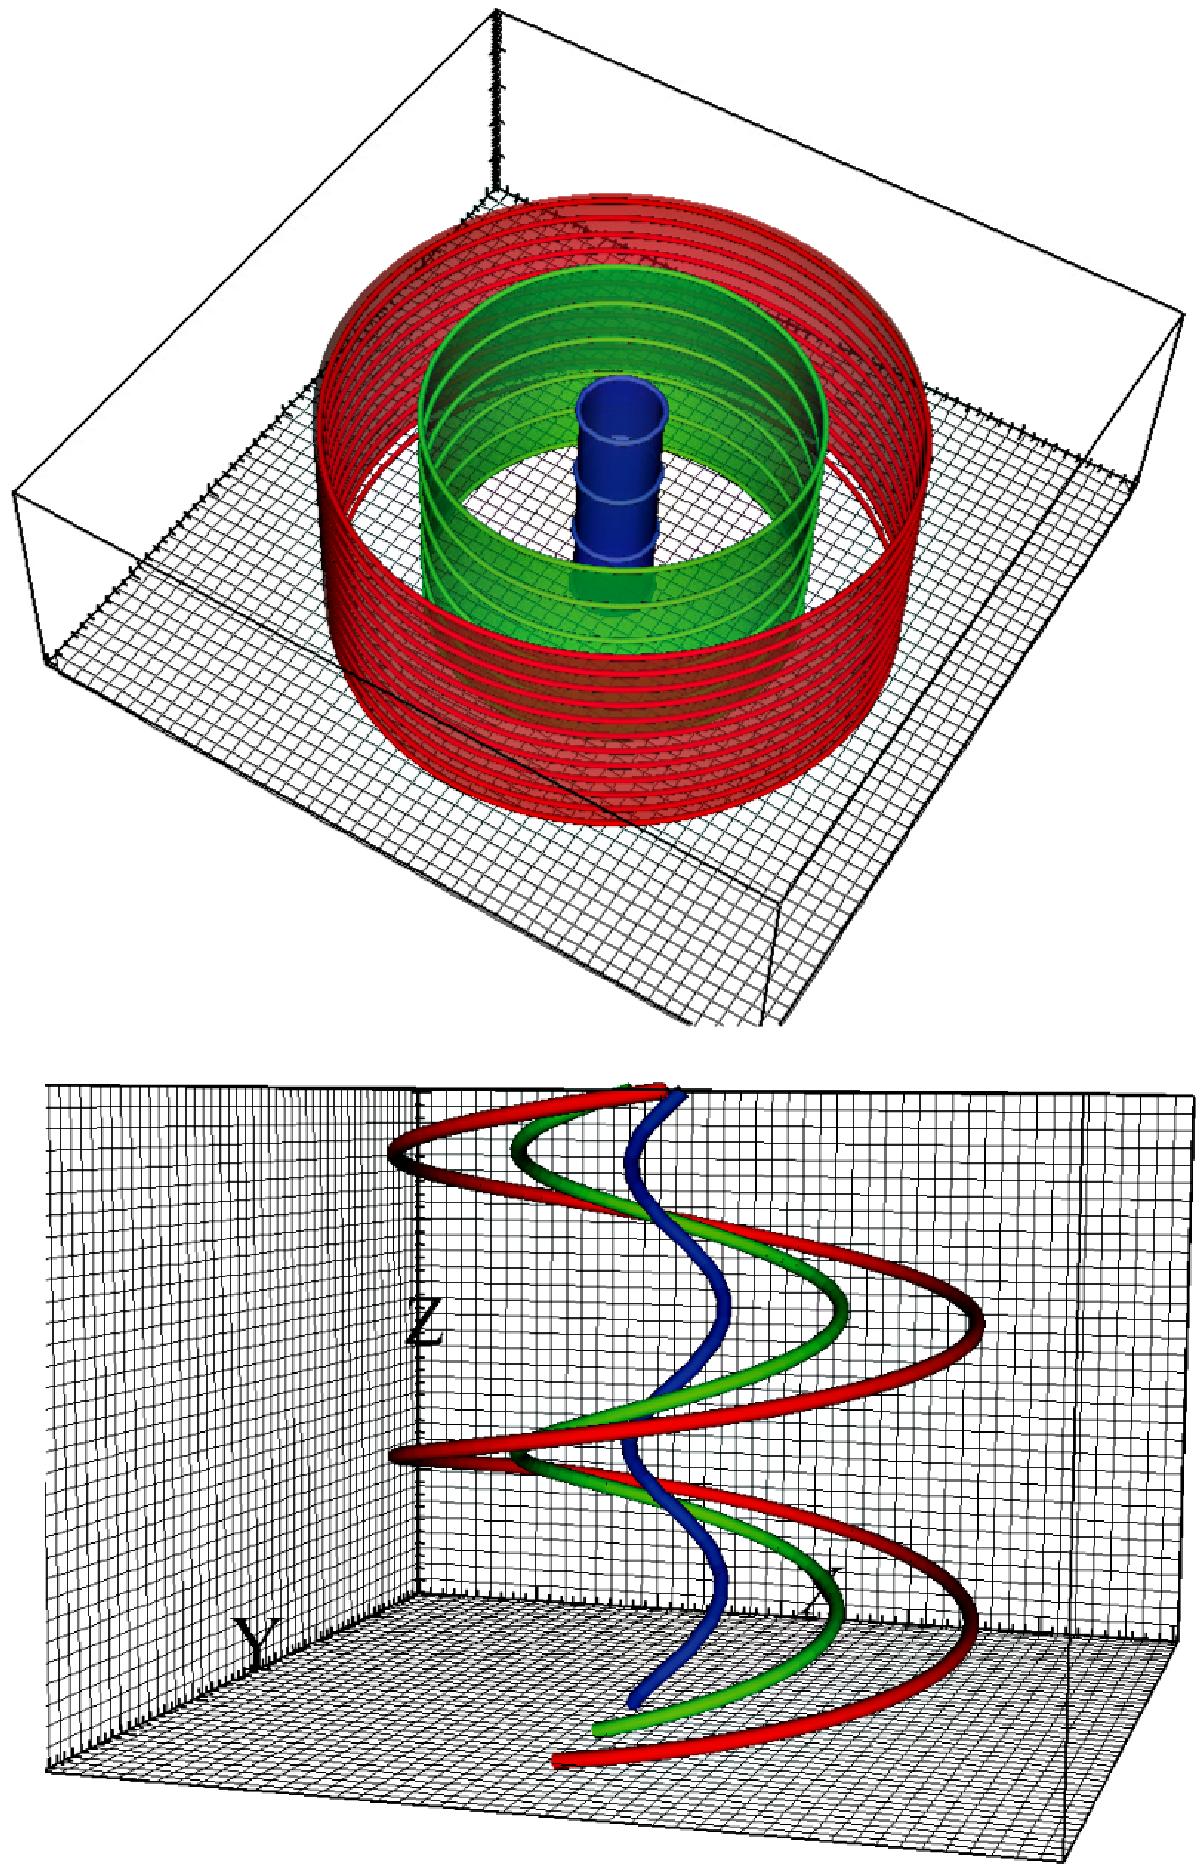
a) Initial purely toroidal magnetic configuration. The region of interest is between 0 ≤ ϖ ≲ ϖ0 given that the field strength falls off at greater ϖ. Colored areas represent surfaces of equal distance to the axis. Field lines are also plotted; their density is related to the increase in the field strength proportional to the distance from the axis. b) Mixed poloidal-toroidal field configuration. The field lines show a spiral morphology, for this particular case (with p = 1) two spirals turns are completed in the box, i.e. toroidal Alfvén frequency is double the vertical Alfvén frequency ωA,φ = 2ωA,z.
Current usage metrics show cumulative count of Article Views (full-text article views including HTML views, PDF and ePub downloads, according to the available data) and Abstracts Views on Vision4Press platform.
Data correspond to usage on the plateform after 2015. The current usage metrics is available 48-96 hours after online publication and is updated daily on week days.
Initial download of the metrics may take a while.