Fig. 11
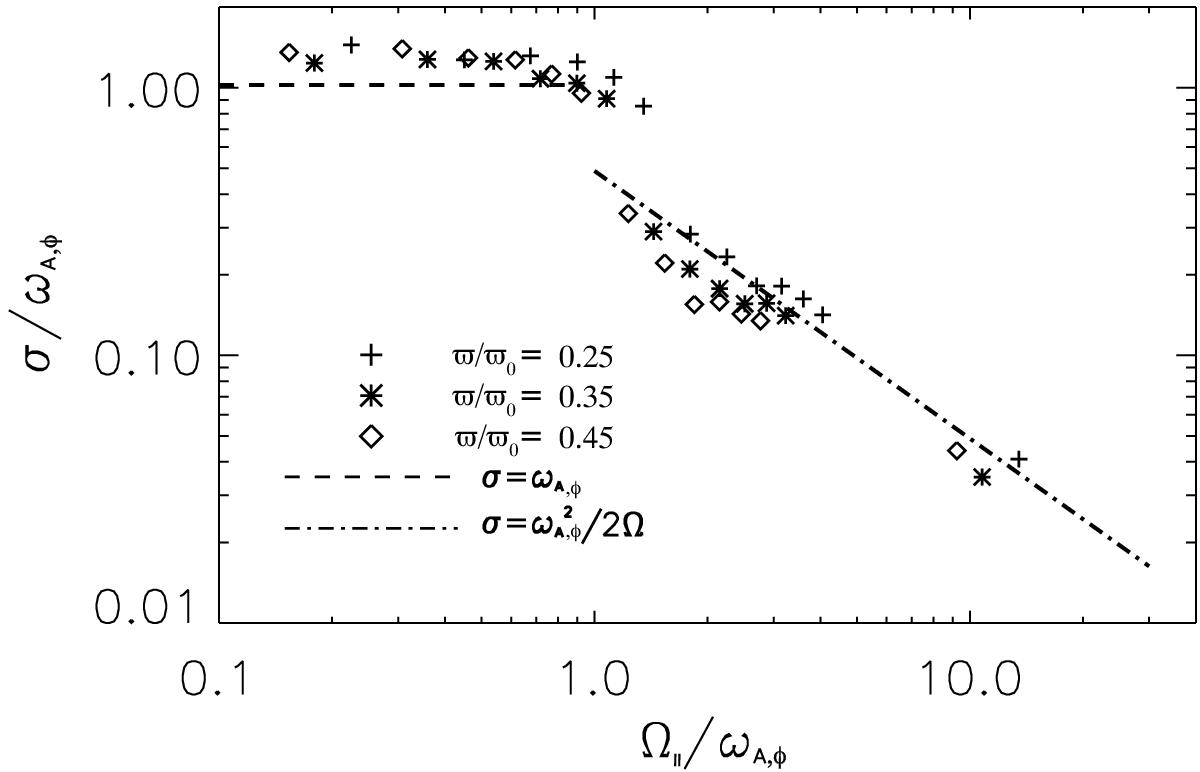
Growth rate σ of the Tayler instability as a function of the solid-body rotation rate Ω∥, in the p = 2 case. Normalized local growth rates are given for three different distances from the axis, σ(ϖ). The dashed line corresponds to the predicted growth rate of the Tayler instability for slow rotators, σ = ωA,φ. The dotted-dashed line is the predicted behavior of the instability for fast rotators, ![]() .
.
Current usage metrics show cumulative count of Article Views (full-text article views including HTML views, PDF and ePub downloads, according to the available data) and Abstracts Views on Vision4Press platform.
Data correspond to usage on the plateform after 2015. The current usage metrics is available 48-96 hours after online publication and is updated daily on week days.
Initial download of the metrics may take a while.