Fig. 9
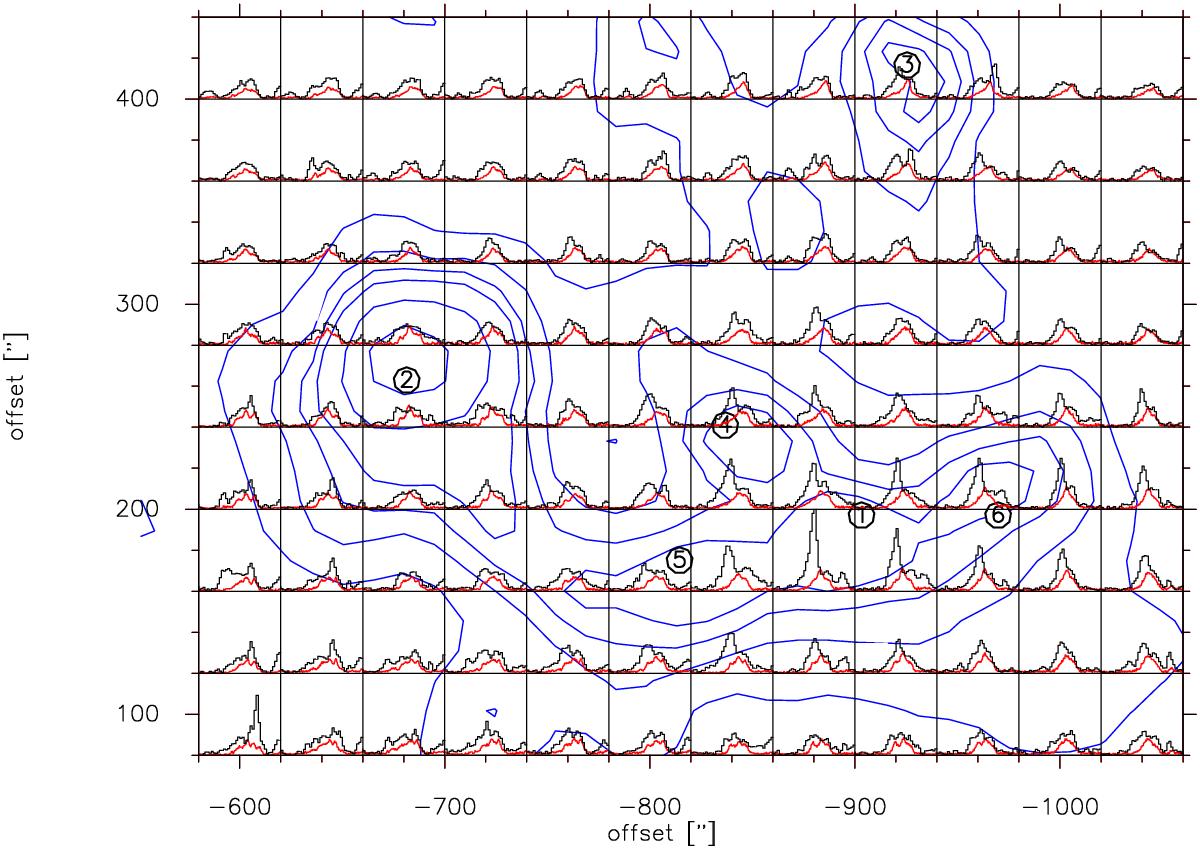
Main beam brightness temperature spectra of 12CO 3 → 2 (black) and 13CO 1→0 (red) emission in the velocity range 55 to 95 km s-1 and temperature range −0.2 to 12 K. The area corresponds to the centre region of the IRDC G28.37+0.07, outlined in Fig. 8. The dust column density from Herschel is overlaid as blue contours (levels 4,5,7,10,16 × 1022 cm-2), and the numbering from 1 to 6 indicates the position of submm-continuum sources labelled using ATLASGAL and subsequently observed in N2H+ (Tackenberg et al. 2014).
Current usage metrics show cumulative count of Article Views (full-text article views including HTML views, PDF and ePub downloads, according to the available data) and Abstracts Views on Vision4Press platform.
Data correspond to usage on the plateform after 2015. The current usage metrics is available 48-96 hours after online publication and is updated daily on week days.
Initial download of the metrics may take a while.