Fig. 8
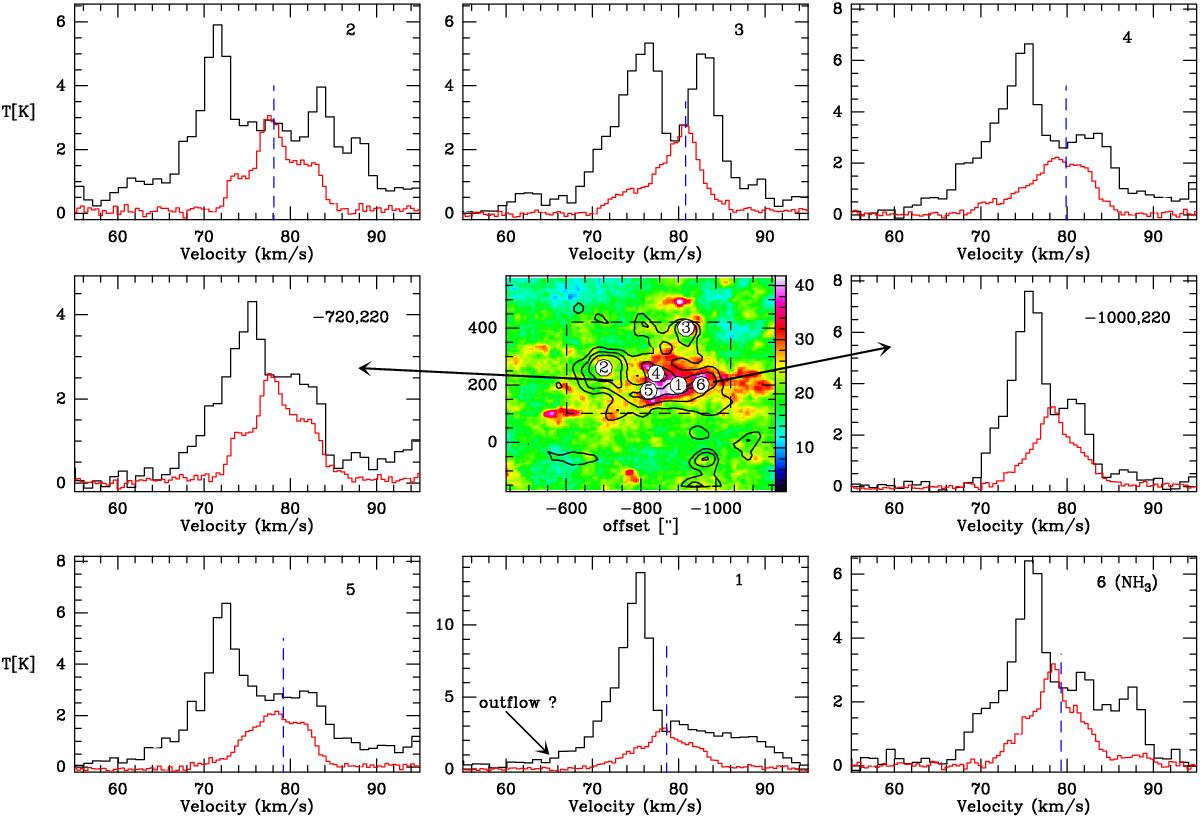
Middle panel: line integrated 12CO 3→2 emission in K kms-1 on a main beam temperature scale (between 72 and 84 km s-1) of G28.37+0.07. The dust column density from Herschel is overlaid as black contours (levels 4,5,7 × 1022 cm-2). The dashed lines outline the area displayed in Fig. 9, and the numbering from 1 to 6 indicates the position of submm-continuum sources seen with ATLASGAL and subsequently observed in N2H+ (Tackenberg et al. 2014). The 12CO 3→2 (black) and 13CO 1→0 (red) spectra at these positions are displayed in the panels around. Additionally, we show spectra from two positions (indicated by arrows) off the sources but still within the molecular cloud. The blue-dashed line denotes the centre velocity of the N2H+ line.
Current usage metrics show cumulative count of Article Views (full-text article views including HTML views, PDF and ePub downloads, according to the available data) and Abstracts Views on Vision4Press platform.
Data correspond to usage on the plateform after 2015. The current usage metrics is available 48-96 hours after online publication and is updated daily on week days.
Initial download of the metrics may take a while.